| Size | Price | Stock | Qty |
|---|---|---|---|
| 5mg |
|
||
| 10mg |
|
||
| 25mg |
|
||
| 50mg |
|
||
| Other Sizes |


Adaptaquin is a novel and potent hydroxyquinoline inhibitor of HIF-PHD (hypoxia-inducible factor prolyl hydroxylase 2) with an IC50 of 2 μM. Adaptaquin can inhibit lipid peroxidation and maintain mitochondrial function.
| ln Vitro |
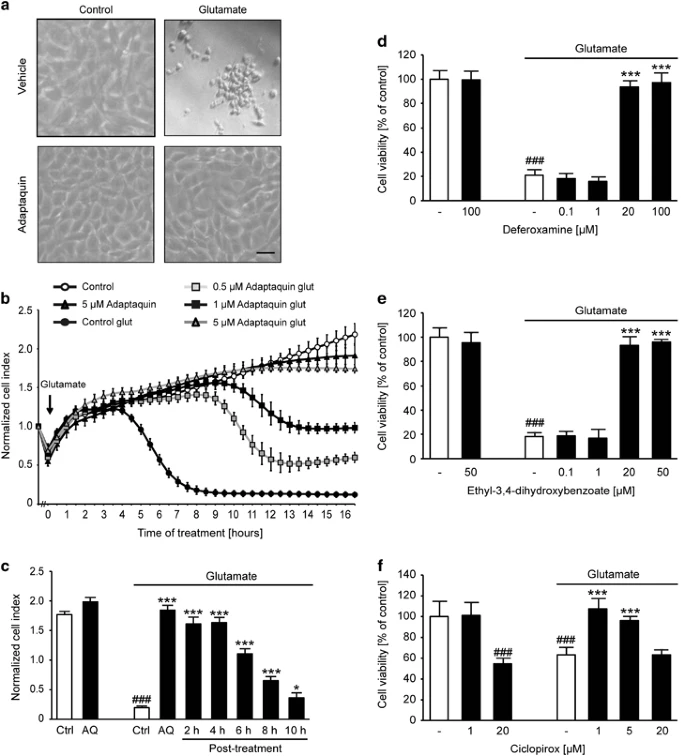
Adaptaquin (2 μM) fully prevented glutamate‑induced morphological hallmarks of cell death (cell shrinkage, rounding, detachment) in HT‑22 hippocampal neuronal cells. [2]
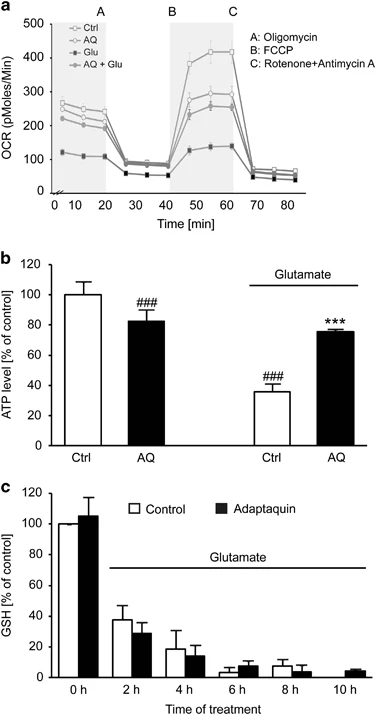
Adaptaquin preserved cell viability in a dose‑dependent manner (tested range not specified as IC₅₀; see xCELLigence real‑time impedance measurement) against 5 mM glutamate‑induced oxytosis. [2] Post‑treatment with adaptaquin up to 4 h after glutamate exposure (5 mM) provided full protection, and even at 10 h post‑glutamate a significant protective effect was observed (p<0.05). [2] Under extracellular calcium‑depleted conditions, adaptaquin (2 μM) still prevented glutamate‑induced cell death, indicating no calcium chelation mechanism. [2] Adaptaquin (2 μM) restored both basal and maximal mitochondrial respiration (oxygen consumption rate, OCR) in glutamate‑treated (4 mM, 15 h) HT‑22 cells as measured by Seahorse XF96. [2] Adaptaquin prevented the loss of mitochondrial ATP production (calculated from OCR) induced by glutamate. [2] Adaptaquin (2 μM) did not rescue the rapid and sustained decrease of glutathione (GSH) levels caused by 5 mM glutamate (GSH dropped below detection limits at 10 h). [2] Adaptaquin (2 μM) reduced the formation of soluble reactive oxygen species (ROS) after 6 h of glutamate (4 mM) as measured by CM‑H₂DCFDA staining, but did not fully abolish it. [2] Adaptaquin dose‑dependently protected HT‑22 cells against H₂O₂‑induced cell death (H₂O₂ 600‑800 μM, 16 h). [2] Adaptaquin did not increase MnSOD (superoxide dismutase 2) expression; glutamate alone strongly upregulated MnSOD, but cotreatment with adaptaquin kept MnSOD levels near baseline. [2] Adaptaquin (2 μM) restored ATF4 protein expression at 14 h after glutamate exposure (which was otherwise downregulated), but did not significantly alter eIF2α phosphorylation. [2] Adaptaquin restored xCT protein expression at 14 h after glutamate exposure. [2] Adaptaquin still protected HT‑22 cells against glutamate‑induced cell death after siRNA‑mediated ATF4 silencing, and prevented the formation of soluble ROS caused by ATF4 knockdown. [2] Adaptaquin (2 μM) did not affect basal cell viability in the absence of glutamate (implied from xCELLigence and MTT controls). [2] |
|---|---|
| Cell Assay |
Cell culture – HT‑22 cells were cultured in Dulbecco’s modified Eagle’s medium supplemented with 10% heat‑inactivated fetal calf serum, 100 U/ml penicillin, 100 mg/ml streptomycin, and 2 mM glutamine. For cell death induction, 3‑7 mM glutamate or 600‑800 μM H₂O₂ was added for indicated times. Adaptaquin was dissolved in DMSO. [2]
Cell viability (MTT assay) – After glutamate treatment, MTT was added to a final concentration of 0.5 mg/ml and incubated for 1 h at 37 °C. The formazan product was dissolved in DMSO and absorbance measured at 570 nm (reference 630 nm). For H₂O₂ treatment, medium was replaced with PBS containing 0.5 mg/ml MTT. [2] Real‑time cell viability (xCELLigence) – Cellular impedance was measured continuously to monitor cell death and protection. [2] Annexin V/PI staining – After ATF4 siRNA transfection and glutamate treatment (6 mM, 25 h), cells were stained with Annexin V‑FITC and propidium iodide, then analysed by FACS (10,000 cells per condition). [2] Mitochondrial ROS (MitoSOX) – Cells were stained with 2.5 μM MitoSOX red for 30 min at 37 °C, then analysed by FACS (excitation 488 nm, emission 690/50 bandpass). [2] Mitochondrial membrane potential (TMRE) – Cells were stained with 200 nM TMRE for 20 min at 37 °C, then analysed by FACS (excitation 488 nm, emission 690/50 bandpass). [2] Lipid peroxidation (BODIPY 581/591 C₁₁) – Cells were stained with 2 μM BODIPY for 1 h at 37 °C, then analysed by FACS for fluorescence shift from green (525/30) to red (690/50). [2] Intracellular soluble ROS (CM‑H₂DCFDA) – Cells were loaded with 2.5 μM CM‑H₂DCFDA in serum‑free medium for 30 min at 37 °C, then incubated 30 min in serum‑containing medium, followed by FACS analysis (excitation 488 nm, emission 525/30 bandpass). [2] ATP measurement – Total ATP levels were measured by luminescence using a ViaLight plus kit following the manufacturer’s protocol. [2] Oxygen consumption rate (Seahorse XF96) – Cells were plated in XF96 microplates (8,000 cells/well) and treated with adaptaquin and glutamate. Assay medium contained 4.5 g/l glucose, 2 mM glutamine, 1 mM pyruvate (pH 7.35). After baseline measurements, oligomycin (3 μM), FCCP (0.4 μM), and rotenone/antimycin A (1 μM) were injected sequentially. [2] GSH measurement – Cells were harvested in MES buffer (0.4 M MES, 0.1 M phosphate, 2 mM EDTA, pH 6.0), sonicated, and deproteinated with metaphosphoric acid. After neutralisation with triethanolamine, GSH was measured using Ellman’s reagent at 405 nm. [2] Western blot – Cells were lysed in buffer containing mannitol, Tris, EDTA, EGTA, DTT, Triton‑X, protease and phosphatase inhibitors. 40‑60 μg protein were separated on 12.5% SDS‑PAGE, transferred to PVDF membrane, and incubated with primary antibodies against PHD1, ATF4, xCT, eIF2α, phospho‑eIF2α, MnSOD, 15‑LOX, and actin. HRP‑conjugated secondary antibodies were used and signals detected by chemiluminescence. [2] siRNA transfection – Cells were transfected with Lipofectamine RNAiMax using siRNAs for ATF4, PHD1 (two sequences), or scrambled control. Cells were treated 48 h after transfection. [2] CRISPR/Cas9 generation of PHD1‑knockdown clones – HT‑22 cells were transfected with PHD1 CRISPR plasmid (U6gRNA‑Cas9‑2A‑GFP). After sorting by FACS, single or multiple cells were seeded into 96‑well plates to establish clones 2.17 and 5.18. [2] |
| References |
|
| Additional Infomation |
Adaptaquin is a branched oxyquinoline molecule that inhibits HIF‑PHDs via iron coordination at the active site, with reduced iron‑chelating properties compared to ciclopirox. It was designed to activate adaptive hypoxic responses. In the glutamate‑induced oxytosis model, adaptaquin acts upstream of mitochondria, preventing lipid peroxidation and mitochondrial dysfunction without restoring GSH levels. Its protective effects are independent of HIF‑1α regulation and do not require ATF4 expression. Structural analyses (not performed in this paper but cited from previous work) indicate that adaptaquin does not fit into the active centre of 12‑lipoxygenase. Adaptaquin may exert its effects by modifying RNA polymerase II and downregulating 12/15‑lipoxygenase expression. [2]
|
| Molecular Formula |
C21H16CLN3O2
|
|---|---|
| Molecular Weight |
377.823643684387
|
| Exact Mass |
377.093
|
| CAS # |
385786-48-1
|
| PubChem CID |
3740671
|
| Appearance |
White to yellow solid powder
|
| Density |
1.4±0.1 g/cm3
|
| Boiling Point |
650.9±55.0 °C at 760 mmHg
|
| Flash Point |
347.4±31.5 °C
|
| Vapour Pressure |
0.0±2.0 mmHg at 25°C
|
| Index of Refraction |
1.753
|
| LogP |
4.63
|
| Hydrogen Bond Donor Count |
3
|
| Hydrogen Bond Acceptor Count |
5
|
| Rotatable Bond Count |
4
|
| Heavy Atom Count |
27
|
| Complexity |
474
|
| Defined Atom Stereocenter Count |
0
|
| SMILES |
C1=CC2=C(C(=C(C=C2)C(C3=CC=C(C=C3)Cl)NC4=C(C=CC=N4)O)O)N=C1
|
| InChi Key |
KKYHNYRUBSYTCZ-UHFFFAOYSA-N
|
| InChi Code |
InChI=1S/C21H16ClN3O2/c22-15-8-5-14(6-9-15)18(25-21-17(26)4-2-12-24-21)16-10-7-13-3-1-11-23-19(13)20(16)27/h1-12,18,26-27H,(H,24,25)
|
| Chemical Name |
7-[(4-chlorophenyl)-[(3-hydroxypyridin-2-yl)amino]methyl]quinolin-8-ol
|
| HS Tariff Code |
2934.99.9001
|
| Storage |
Powder -20°C 3 years 4°C 2 years In solvent -80°C 6 months -20°C 1 month |
| Shipping Condition |
Room temperature (This product is stable at ambient temperature for a few days during ordinary shipping and time spent in Customs)
|
| Solubility (In Vitro) |
DMSO : ~100 mg/mL (~264.68 mM)
|
|---|---|
| Solubility (In Vivo) |
Note: Listed below are some common formulations that may be used to formulate products with low water solubility (e.g. < 1 mg/mL), you may test these formulations using a minute amount of products to avoid loss of samples.
Injection Formulations
Injection Formulation 1: DMSO : Tween 80: Saline = 10 : 5 : 85 (i.e. 100 μL DMSO stock solution → 50 μL Tween 80 → 850 μL Saline)(e.g. IP/IV/IM/SC) *Preparation of saline: Dissolve 0.9 g of sodium chloride in 100 mL ddH ₂ O to obtain a clear solution. Injection Formulation 2: DMSO : PEG300 :Tween 80 : Saline = 10 : 40 : 5 : 45 (i.e. 100 μL DMSO → 400 μLPEG300 → 50 μL Tween 80 → 450 μL Saline) Injection Formulation 3: DMSO : Corn oil = 10 : 90 (i.e. 100 μL DMSO → 900 μL Corn oil) Example: Take the Injection Formulation 3 (DMSO : Corn oil = 10 : 90) as an example, if 1 mL of 2.5 mg/mL working solution is to be prepared, you can take 100 μL 25 mg/mL DMSO stock solution and add to 900 μL corn oil, mix well to obtain a clear or suspension solution (2.5 mg/mL, ready for use in animals). View More
Injection Formulation 4: DMSO : 20% SBE-β-CD in saline = 10 : 90 [i.e. 100 μL DMSO → 900 μL (20% SBE-β-CD in saline)] Oral Formulations
Oral Formulation 1: Suspend in 0.5% CMC Na (carboxymethylcellulose sodium) Oral Formulation 2: Suspend in 0.5% Carboxymethyl cellulose Example: Take the Oral Formulation 1 (Suspend in 0.5% CMC Na) as an example, if 100 mL of 2.5 mg/mL working solution is to be prepared, you can first prepare 0.5% CMC Na solution by measuring 0.5 g CMC Na and dissolve it in 100 mL ddH2O to obtain a clear solution; then add 250 mg of the product to 100 mL 0.5% CMC Na solution, to make the suspension solution (2.5 mg/mL, ready for use in animals). View More
Oral Formulation 3: Dissolved in PEG400 (Please use freshly prepared in vivo formulations for optimal results.) |
| Preparing Stock Solutions | 1 mg | 5 mg | 10 mg | |
| 1 mM | 2.6468 mL | 13.2338 mL | 26.4676 mL | |
| 5 mM | 0.5294 mL | 2.6468 mL | 5.2935 mL | |
| 10 mM | 0.2647 mL | 1.3234 mL | 2.6468 mL |
*Note: Please select an appropriate solvent for the preparation of stock solution based on your experiment needs. For most products, DMSO can be used for preparing stock solutions (e.g. 5 mM, 10 mM, or 20 mM concentration); some products with high aqueous solubility may be dissolved in water directly. Solubility information is available at the above Solubility Data section. Once the stock solution is prepared, aliquot it to routine usage volumes and store at -20°C or -80°C. Avoid repeated freeze and thaw cycles.
Calculation results
Working concentration: mg/mL;
Method for preparing DMSO stock solution: mg drug pre-dissolved in μL DMSO (stock solution concentration mg/mL). Please contact us first if the concentration exceeds the DMSO solubility of the batch of drug.
Method for preparing in vivo formulation::Take μL DMSO stock solution, next add μL PEG300, mix and clarify, next addμL Tween 80, mix and clarify, next add μL ddH2O,mix and clarify.
(1) Please be sure that the solution is clear before the addition of next solvent. Dissolution methods like vortex, ultrasound or warming and heat may be used to aid dissolving.
(2) Be sure to add the solvent(s) in order.
|
|
|
Products are for research use only; We do not sell to patients
Copyright 2020 InvivoChem LLC | All Rights Reserved