| Size | Price | Stock | Qty |
|---|---|---|---|
| 5mg |
|
||
| 10mg |
|
||
| 50mg |
|
||
| 100mg |
|
||
| 250mg |
|
||
| 500mg | |||
| Other Sizes |
Purity: ≥98%
| Targets |
Cationic fluorescent dye; Mitochondrial membrane potential (mtMP); TMRM is a fluorescent probe that accumulates in mitochondria in response to negative membrane potential. [2][3]
|
|---|---|
| ln Vitro |
1. Preparation of TMRM Working Solution
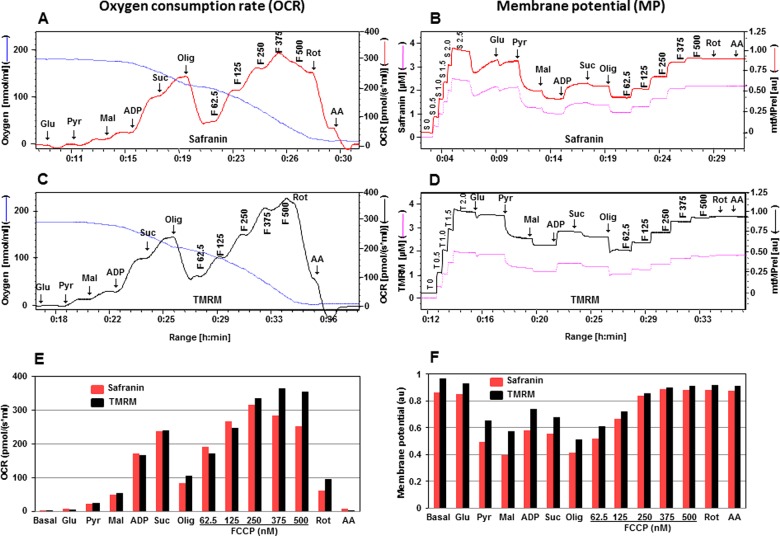
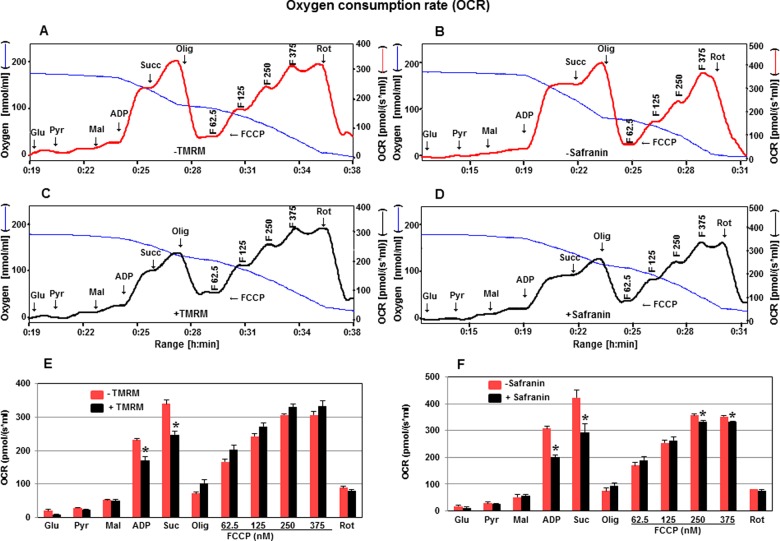
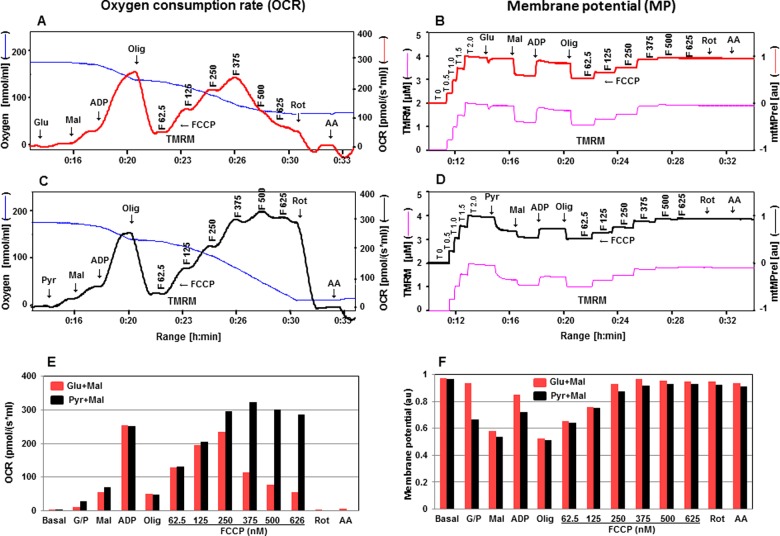
1.1 Preparation of Stock Solution Dissolve 1 mg of TMRM in 339 µL of DMSO to prepare a 5 mM stock solution. 1.2 Preparation of Working Solution Dilute the stock solution with serum-free cell culture medium or PBS to obtain a TMRM working solution at a concentration of 1–20 µM. Note: The concentration of the working solution can be adjusted according to experimental needs. 2. Cell Staining Procedure 2.1 Staining of Suspension Cells (using a 6-well plate as an example) a. Collect the cell suspension and centrifuge at 1000g for 3–5 minutes at 4°C, then discard the supernatant; b. Wash the cells twice with PBS, 5 minutes each time, and adjust the cell density to 1×10⁶/mL; c. Add 1 mL of TMRM working solution and incubate at room temperature protected from light for 5–30 minutes; d. Centrifuge at 400g for 3–4 minutes at 4°C and discard the supernatant; e. Wash the cells twice with PBS, 5 minutes each time; f. Resuspend the cells in serum-free medium or PBS, then proceed to observation under a fluorescence microscope or analysis by flow cytometry. 2.2 Staining of Adherent Cells a. Culture adherent cells on sterile coverslips; b. Remove the coverslips and aspirate excess medium; c. Add 100 µL of TMRM working solution, gently swirl to ensure even coverage of the cells, and incubate at room temperature protected from light for 30–60 minutes; d. Wash twice with medium, 5 minutes each time; e. Observe directly under a fluorescence microscope or digest and resuspend the cells for flow cytometry analysis. Note: If flow cytometry is used for detection, cells must be digested and resuspended into a single-cell suspension before staining. - In isolated rat cortical mitochondria, TMRM (2 μM) allowed simultaneous measurement of oxygen consumption rate (OCR) and mitochondrial membrane potential (mtMP) using an Oroboros Oxygraph-2K. TMRM decreased coupled respiration by approximately 27% compared to dye-free controls. Maximal uncoupled respiration (with FCCP) was not affected by TMRM. [2] - In cultured rat hippocampal neurons, TMRM (50–500 nM) selectively stained mitochondria and displayed spontaneous fluctuations in mitochondrial fluorescence. FCCP (1 μM) induced loss of mitochondrial fluorescence and a corresponding increase in cytosolic fluorescence. [3] - Higher concentrations of TMRM (1–25 μM) stained mitochondria more rapidly (plateau within 5–10 min). After 45–60 min of exposure, some neurons exhibited a large spontaneous increase in cellular fluorescence, followed by slow oscillations (periods of 5–20 min) and propagating waves of fluorescence. Glial cells did not show these responses. [3] - 1P ratiometric imaging (excitation at 546 and 573 nm) showed that FCCP induced an increase in the 573/546 ratio, indicating movement of TMRM from quenched (hydrophobic) to unquenched (hydrophilic) compartments. Similar ratio changes were observed during spontaneous fluorescence oscillations. [3] - TMRM oscillations persisted in neurons pre-treated with FCCP (1–100 μM) or thapsigargin (10 μM), indicating that functional mitochondria were not required for these responses. [3] - TMRM oscillations did not correlate with changes in intracellular Ca²⁺ (measured with Fluo-3). Lowering extracellular Ca²⁺ or intracellular EGTA dialysis inhibited oscillations, but Ca²⁺ spikes occurred independently of TMRM oscillations. [3] - Fluorescence lifetime imaging (FLIM) showed a significant phase shift in TMRM fluorescence between high and low fluorescent states, consistent with dye movement between hydrophobic and hydrophilic compartments. [3] |
| Enzyme Assay |
- Oxygen consumption rate (OCR) measurement: Isolated mitochondria or tissue homogenates were resuspended in KCl-enriched buffer (80 mM KCl, 10 mM Tris/HCl, 3 mM MgCl₂, 1 mM EDTA, 5 mM potassium phosphate, pH 7.4). Substrates (glutamate, pyruvate, malate, succinate), ADP, oligomycin, FCCP, rotenone, and antimycin A were added sequentially. OCR was measured at 37°C using an Oroboros Oxygraph-2K with fluorescence LED2 module. [2]
- Mitochondrial membrane potential (mtMP) measurement: Safranin (2.5 μM) or TMRM (2 μM) was used as fluorescent probe. The Oroboros system simultaneously recorded fluorescence signals (excitation/emission: safranin 495/587 nm; TMRM 530/592 nm) and OCR. [2] - 1P ratiometric imaging: Cells were excited sequentially at 546 and 573 nm (5 nm bandwidth) using a monochromator. Emission was detected at 620/60 nm. Ratio images (573/546) were formed every 200 msec. [3] - Fluorescence lifetime imaging (FLIM): Two-photon excitation at 810 nm was used. Phase and modulation images were collected using a FastFLIM module. Fluorescence lifetimes were analyzed using the phasor plot method. [3] |
| Cell Assay |
- Isolated rat cortical mitochondria: Mitochondria were isolated from rat brain cortex by differential centrifugation. Protein content was measured by Bradford assay. For OCR/mtMP measurements, 200–300 μg of mitochondrial protein was used. [2]
- Primary rat hippocampal neuron cultures: Cultures were prepared from embryonic day 18 rat hippocampi and grown on glial feeder layers for 12–30 days in vitro. TMRM was bath-applied at concentrations of 50 nM to 25 μM. Imaging was performed at room temperature. [3] - Apoptosis assay: Cultures were exposed to TMRM for 1 hr at 37°C, then post-incubated for 18 hrs. Cells were stained with Hoechst 33258 (2 μg/mL) for 20 min. Apoptotic cells were identified as brightly fluorescent nuclei under UV excitation. Cell survivability was calculated as percentage of live cells. [3] - Calcium imaging: Cells were loaded with Fluo-3 AM (5 μM) for 1 hr at 37°C, then post-incubated for 1 hr. Dual-probe imaging of Fluo-3 and TMRM was performed using two-photon microscopy. [3] |
| Animal Protocol |
- No animal protocols for TMRM are reported in the provided texts. The neuronal cultures were derived from embryonic rats, and brain slices were prepared from mice, but no in vivo administration of TMRM is described. [3]
|
| Toxicity/Toxicokinetics |
- In isolated rat cortical mitochondria, TMRM (2 μM) decreased coupled respiration by approximately 27% compared to dye-free controls, indicating mild toxicity. Maximal uncoupled respiration was not affected. [2]
- In cultured hippocampal neurons, exposure to TMRM (50–200 nM) for 1 hr did not significantly affect cell survivability (∼80%, similar to controls). Higher concentrations (0.5 μM and 2.5 μM) induced substantially greater cell death. A 1-hr exposure to 2.5 μM TMRM resulted in approximately 40% survivability. Survivability decreased progressively over 48 hrs following a 1-hr exposure, consistent with apoptosis. Shorter exposures (5–15 min) were less toxic. [3] - Prolonged exposure to high concentrations of TMRM (1–25 μM) induced spontaneous increases in fluorescence, oscillations, and waves in some neurons, which were followed by apoptosis. [3] |
| References |
|
| Additional Infomation |
- TMRM (tetramethylrhodamine methyl ester) is a cationic, membrane-permeable fluorescent dye that accumulates in mitochondria in response to negative mitochondrial membrane potential (Nernstian distribution). It is widely used to study mitochondrial function in living cells. [2][3]
- TMRM fluorescence is quenched when the dye accumulates in mitochondrial membranes. Unquenched dye partitions in the mitochondrial intermembranous space. Ratiometric imaging (573/546 nm excitation) can distinguish between quenched and unquenched dye. [3] - The two-photon excitation peak of TMRM is 830 nm. In this study, 820 nm was used to minimize phototoxicity. [3] - TMRM is amphipathic and readily partitions into cellular membranes, including nuclear membranes. [3] - Compared to safranin, TMRM showed less toxicity on FCCP-stimulated maximal respiration, making it a better choice for simultaneous OCR and mtMP measurements. However, safranin exhibited higher sensitivity to changes in mtMP. [2] |
| Molecular Formula |
C25H25CLN2O7
|
|---|---|
| Molecular Weight |
500.9282
|
| Exact Mass |
500.135
|
| Elemental Analysis |
C, 59.94; H, 5.03; Cl, 7.08; N, 5.59; O, 22.36
|
| CAS # |
115532-50-8
|
| Related CAS # |
TMRM;115532-49-5
|
| PubChem CID |
11755725
|
| Appearance |
Green to dark green solid powder
|
| Melting Point |
274–276℃
|
| LogP |
4.303
|
| Hydrogen Bond Donor Count |
0
|
| Hydrogen Bond Acceptor Count |
8
|
| Rotatable Bond Count |
4
|
| Heavy Atom Count |
35
|
| Complexity |
868
|
| Defined Atom Stereocenter Count |
0
|
| InChi Key |
PFYWPQMAWCYNGW-UHFFFAOYSA-M
|
| InChi Code |
InChI=1S/C25H25N2O3.ClHO4/c1-26(2)16-10-12-20-22(14-16)30-23-15-17(27(3)4)11-13-21(23)24(20)18-8-6-7-9-19(18)25(28)29-5;2-1(3,4)5/h6-15H,1-5H3;(H,2,3,4,5)/q+1;/p-1
|
| Chemical Name |
[6-(dimethylamino)-9-(2-methoxycarbonylphenyl)xanthen-3-ylidene]-dimethylazanium;perchlorate
|
| Synonyms |
115532-50-8; T-668; Tetramethylrhodamine methyl ester perchlorate; T668; RefChem:897364; 634-218-8; TMRM Perchlorate;
|
| HS Tariff Code |
2934.99.9001
|
| Storage |
Powder -20°C 3 years 4°C 2 years In solvent -80°C 6 months -20°C 1 month Note: Please store this product in a sealed and protected environment (e.g. under nitrogen), avoid exposure to moisture and light. |
| Shipping Condition |
Room temperature (This product is stable at ambient temperature for a few days during ordinary shipping and time spent in Customs)
|
| Solubility (In Vitro) |
DMSO : ~41.67 mg/mL (~83.19 mM)
|
|---|---|
| Solubility (In Vivo) |
Note: Listed below are some common formulations that may be used to formulate products with low water solubility (e.g. < 1 mg/mL), you may test these formulations using a minute amount of products to avoid loss of samples.
Injection Formulations
Injection Formulation 1: DMSO : Tween 80: Saline = 10 : 5 : 85 (i.e. 100 μL DMSO stock solution → 50 μL Tween 80 → 850 μL Saline)(e.g. IP/IV/IM/SC) *Preparation of saline: Dissolve 0.9 g of sodium chloride in 100 mL ddH ₂ O to obtain a clear solution. Injection Formulation 2: DMSO : PEG300 :Tween 80 : Saline = 10 : 40 : 5 : 45 (i.e. 100 μL DMSO → 400 μLPEG300 → 50 μL Tween 80 → 450 μL Saline) Injection Formulation 3: DMSO : Corn oil = 10 : 90 (i.e. 100 μL DMSO → 900 μL Corn oil) Example: Take the Injection Formulation 3 (DMSO : Corn oil = 10 : 90) as an example, if 1 mL of 2.5 mg/mL working solution is to be prepared, you can take 100 μL 25 mg/mL DMSO stock solution and add to 900 μL corn oil, mix well to obtain a clear or suspension solution (2.5 mg/mL, ready for use in animals). View More
Injection Formulation 4: DMSO : 20% SBE-β-CD in saline = 10 : 90 [i.e. 100 μL DMSO → 900 μL (20% SBE-β-CD in saline)] Oral Formulations
Oral Formulation 1: Suspend in 0.5% CMC Na (carboxymethylcellulose sodium) Oral Formulation 2: Suspend in 0.5% Carboxymethyl cellulose Example: Take the Oral Formulation 1 (Suspend in 0.5% CMC Na) as an example, if 100 mL of 2.5 mg/mL working solution is to be prepared, you can first prepare 0.5% CMC Na solution by measuring 0.5 g CMC Na and dissolve it in 100 mL ddH2O to obtain a clear solution; then add 250 mg of the product to 100 mL 0.5% CMC Na solution, to make the suspension solution (2.5 mg/mL, ready for use in animals). View More
Oral Formulation 3: Dissolved in PEG400 (Please use freshly prepared in vivo formulations for optimal results.) |
| Preparing Stock Solutions | 1 mg | 5 mg | 10 mg | |
| 1 mM | 1.9963 mL | 9.9814 mL | 19.9629 mL | |
| 5 mM | 0.3993 mL | 1.9963 mL | 3.9926 mL | |
| 10 mM | 0.1996 mL | 0.9981 mL | 1.9963 mL |
*Note: Please select an appropriate solvent for the preparation of stock solution based on your experiment needs. For most products, DMSO can be used for preparing stock solutions (e.g. 5 mM, 10 mM, or 20 mM concentration); some products with high aqueous solubility may be dissolved in water directly. Solubility information is available at the above Solubility Data section. Once the stock solution is prepared, aliquot it to routine usage volumes and store at -20°C or -80°C. Avoid repeated freeze and thaw cycles.
Calculation results
Working concentration: mg/mL;
Method for preparing DMSO stock solution: mg drug pre-dissolved in μL DMSO (stock solution concentration mg/mL). Please contact us first if the concentration exceeds the DMSO solubility of the batch of drug.
Method for preparing in vivo formulation::Take μL DMSO stock solution, next add μL PEG300, mix and clarify, next addμL Tween 80, mix and clarify, next add μL ddH2O,mix and clarify.
(1) Please be sure that the solution is clear before the addition of next solvent. Dissolution methods like vortex, ultrasound or warming and heat may be used to aid dissolving.
(2) Be sure to add the solvent(s) in order.
| NCT Number | Recruitment | interventions | Conditions | Sponsor/Collaborators | Start Date | Phases |
| NCT02650154 | Completed | Trauma | The Hospital for Sick Children | 2013-08 | ||
| NCT03415503 | Completed | Drug: Medox® Anthocyanin capsules | Dyslipidemias | Sun Yat-sen University | 2018-10-01 | Phase 3 |
| NCT05071391 | Completed | Procedure: Roux-en-Y gastric bypass | Obesity | Milagros Rocha Barajas | 2017-01-01 |
|
|
|
Products are for research use only; We do not sell to patients
Copyright 2020 InvivoChem LLC | All Rights Reserved


 COA
COA