| Size | Price | Stock | Qty |
|---|---|---|---|
| 5mg |
|
||
| 10mg |
|
||
| 50mg |
|
||
| 100mg |
|
||
| 250mg | |||
| Other Sizes |


| Targets |
AT2/1 Receptor
|
|---|---|
| ln Vitro |
Proliferating cell nuclear antigen (PCNA) protein, which is increased by Ang II, is not expressed when Ang-(1–7) is inhibited, while A-779 by itself has little effect on causing VSMC migration and proliferation. A-779 blocks the effects of Ang-(1-7) on the VSMC inflammatory response, which is linked to the elevation of MCP-1, VCAM-1, and IL-1β production. Ang-(1-7) pretreatment can greatly delay this inflammatory response. But A-779 by itself was unable to cause VSMCs to become inflamed. VSMCs treated with Ang-(1-7) for 5 minutes prior to Ang II-induced activation of Akt and ERK1/2 was considerably reduced. A-779 also had this effect, although it did not cause Akt and ERK1 phosphorylation on its own. /2's function in VSMC[3].
Results: (1) The results of Annexin V-FITC/PI double staining flow cytometry showed that the proportion of apoptotic cells was higher in ox-LDL group than in control group ((21.18±1.40)% vs. (1.59±0.26)%, P<0.01), lower in ox-LDL+ Ang-(1-7) group((7.42±1.07)%) and ox-LDL+ HTA125 group((9.19±1.01)%) than in ox-LDL group (both P<0.01), higher in ox-LDL+ Ang-(1-7)+ A-779 group ((19.91±1.30)%) and ox-LDL+ A-779 group((20.47±0.95)%) than in ox-LDL+ Ang-(1-7) group (both P<0.01). (2) The TUNEL results showed that the proportion of apoptotic cells was higher in ox-LDL group than in control group((10.83±0.77)% vs. (2.83±0.82)%, P<0.01), lower in ox-LDL+ Ang-(1-7) group ((3.66±0.54)%)and ox-LDL+ HTA125 group((4.97±0.60)%) than in ox-LDL group(both P<0.01), higher in ox-LDL+ Ang-(1-7)+ A-779 group((10.69±0.62)%) and ox-LDL+ A-779 group((11.43±0.42)%) than in ox-LDL+ Ang-(1-7) group (both P<0.01). (3) ROS level was higher in ox-LDL group than in control group(0.093±0.014 vs. 0.053±0.011, P<0.01), lower in ox-LDL+ Ang-(1-7) group (0.063±0.011, P<0.01)and ox-LDL+ HTA125 group(0.070±0.010, P<0.05)than in ox-LDL group, higher in ox-LDL+ Ang-(1-7)+ A-779 group(0.088±0.003) and ox-LDL+ A-779 group(0.095±0.005) than in ox-LDL+ Ang-(1-7) group (both P<0.01). (4) The mRNA expression level of NOX4 was higher in ox-LDL group than in control group(11.74±0.65 vs. 1.00±0.00, P<0.01), lower in ox-LDL+ Ang-(1-7) group (2.85±0.75)and ox-LDL+ HTA125 group(5.57±0.52) than in ox-LDL group(both P<0.01), higher in ox-LDL+ Ang-(1-7)+ A-779 group(10.51±0.54) and ox-LDL+ A-779 group (11.04±1.01) than in ox-LDL+ Ang-(1-7) group (both P<0.01), higher in ox-LDL group than in control group(27.60±1.86 vs. 1.00±0.00, P<0.01), lower in ox-LDL+ Ang-(1-7) group (8.00±1.03)and ox-LDL+ HTA125 group(14.83±0.97)than in ox-LDL group(both P<0.01), higher in ox-LDL+ Ang-(1-7)+ A-779 group(24.81±2.19) and ox-LDL+ A-779 group (26.64±0.65)than in ox-LDL+ Ang-(1-7) group (both P<0.01). (5)The protein expression level of NOX4 was higher in ox-LDL group than in control group (0.61±0.09 vs. 0.23±0.02, P<0.01), lower in ox-LDL+ Ang-(1-7) group(0.27±0.03) and ox-LDL+ HTA125 group(0.22±0.02) than in ox-LDL group(both P<0.01), higher in ox-LDL+ Ang-(1-7)+ A-779 group (0.58±0.06)and ox-LDL+ A-779 group(0.61±0.03) than in ox-LDL+ Ang-(1-7) group (both P<0.01). The protein expression level of TLR4 was higher in ox-LDL group than in control group(0.18±0.02 vs. 0.08±0.01, P<0.01), lower in ox-LDL+ Ang-(1-7) group(0.07±0.01) and ox-LDL+ HTA125 group(0.09±0.01) than in ox-LDL group(both P<0.01), higher in ox-LDL+ Ang-(1-7)+ A-779 group(0.18±0.02) and ox-LDL+ A-779 group(0.20±0.02) than in ox-LDL+ Ang-(1-7) group (both P<0.01). Conclusion: TLR4 mediated the ox-LDL induced injury in HUVECs, and Ang-(1-7) could attenuate ox-LDL induced injury in HUVECs by modulating the specific Mas receptors [3]. |
| ln Vivo |
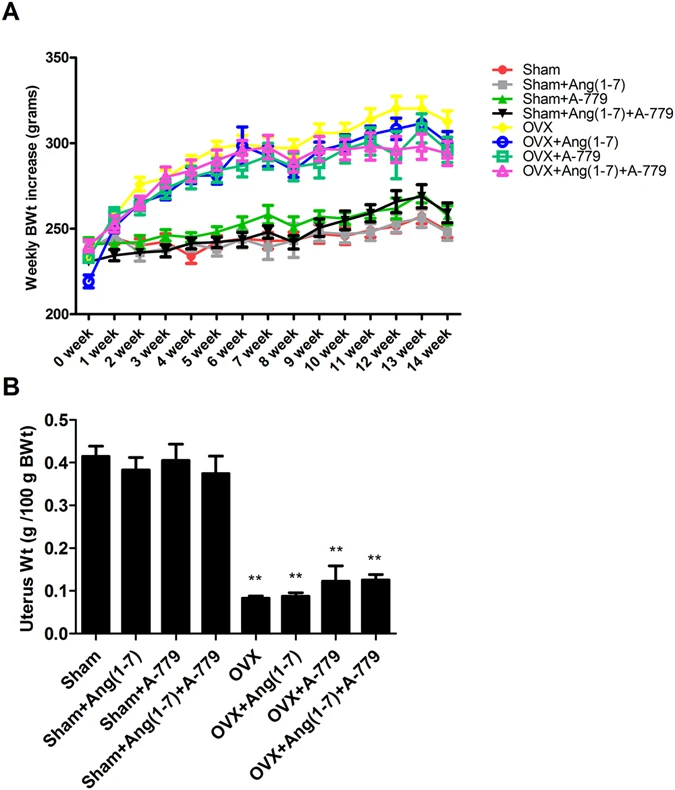
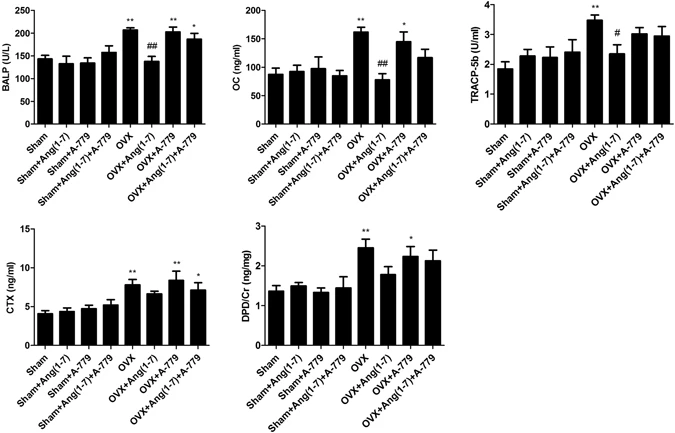
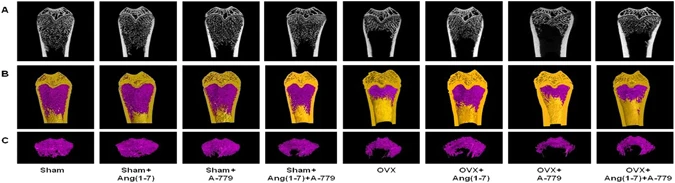
For six weeks, OVX rats receiving an infusion of Ang(1-7) and A-779 (400?ng/kg/min, sc) either alone or in combination did not stop uterine atrophy or inhibit weight gain. Serum levels of type I collagen telopeptide (CTX), tartrate-resistant acid phosphatase (TRAcP 5b), osteocalcin (OC), urine deoxypyridine phenylin (DPD), and bone-specific alkaline phosphatase (BALP) are all markedly elevated by A-779. Serum mineral concentrations in the OVX or sham groups were not significantly changed by the infusion of Ang(1–7) and/or A-779. In contrast to the OVX group, A-779 in OVX animals did not change the expression of AngII, Ang(1-7), AT1R, AT2R, ACE, ACE-2, Mas receptor, RANKL, or OPG protein. However, A-779 (400ng/kg/min) significantly reduced the protective effects of captopril on bone metabolism, mineralization, and microstructure. A-779 also Restored the effect of OVX on RANKL expression ACE-1/AngII/AT1R cascade and downregulated OPG expression and ACE-2/Ang1-7/Mas pathway [2].
|
| Cell Assay |
Culture and Grouping of Human Umbilical Vein Endothelial Cells (HUVECs):
HUVECs were cultured in RPMI-1640 medium supplemented with 10% fetal bovine serum (FBS) and 1% penicillin-streptomycin in a 37°C, 5% CO₂ incubator. Cell growth was monitored using an inverted phase-contrast microscope. When cell confluence reached ≥80%, the cells were washed with phosphate-buffered saline (PBS; containing 8.0 g NaCl, 0.2 g KCl, 3.4 g Na₂HPO₄·H₂O, and 0.2 g KH₂PO₄, pH 7.4) and digested with 0.25% trypsin and 0.04% EDTA for subculture. Cells were seeded in 6-well plates at a density of 5×10⁵ cells/mL. Upon reaching 80% confluence, they were synchronized in serum-free medium for 12 h before grouping. Experimental Groups: 1. Control group (no intervention) 2. ox-LDL group (treated with 75 mg/L ox-LDL) 3. ox-LDL + Ang-(1-7) group (pretreated with 1 μmol/L Ang-(1-7) for 30 min, then treated with 75 mg/L ox-LDL) 4. ox-LDL + Ang-(1-7) + A-779 group (pretreated with 1 μmol/L A-779 [Mas receptor antagonist] for 30 min, followed by 1 μmol/L Ang-(1-7) for 30 min, then treated with 75 mg/L ox-LDL) 5. ox-LDL + A-779 group (pretreated with 1 μmol/L A-779 for 30 min, then treated with 75 mg/L ox-LDL) 6. ox-LDL + HTA125 group (pretreated with 10 μg/L HTA125 [TLR4-specific blocking antibody] for 30 min, then treated with 75 mg/L ox-LDL) |
| Animal Protocol |
The experimental model and study protocol [1]
A bilateral OVX operation was use to induce postmenopausal osteoporosis in female Wistar albino rats. The animals were generally anesthetized using single IP injection of ketamine + xylazine combination (80 mg/kg and 5 mg/kg; respectively). After ligation, the ovaries were excised from a longitudinal incision made on the dorsolateral body region. Sham rats had the same procedure without the ligation and excision. The risk of postoperative infection was eliminated by applying fusidic acid topical antibiotic cream twice weekly for 4 weeks. Following the sham and OVX operations, animals were divided into eight groups (n = 8/group) including, Sham, Sham + Ang(1-7), Sham +A-779, Sham + Ang(1-7)+A-779, OVX, OVX + Ang(1-7), OVX + A-779 and OVX + Ang(1-7)+A-779. Eight weeks following sham and OVX operations, osmotic pumps were implanted subcutaneously to deliver Ang(1-7) (200 ng/kg/min), A-779 (400 ng/kg/min) or a mixture of Ang(1-7) and A-779 (200 ng/kg/min and 400 ng/kg/min; respectively) for 6 consecutive weeks. Body weights of all animals were monitored and recorded at the beginning and every week throughout the study. Animals’ general health was maintained during periods of treatments. At the end of treatments periods, animals were placed fasting in metabolic cages for 16 hr and urine samples were collected and frozen at −70 °C. Then, the blood samples were collected by cardiac puncture under ketamine + xylazine anesthesia and serum samples were obtain by centrifugation at 4000 RPM to. Animals were then sacrificed by decapitation and the uterine tissues and femoral bones were removed and cleaned. Uterine tissues were cleaned from fats and the wet weights were determined directly and expressed as g/100 g body weight. In each rat, both femurs were removed and cleaned from soft tissues. The left femoral bone samples were frozen at −70 °C until analyzed, while the right femoral bones were kept in 10% formalin for mico-CT and minerals analysis. Study design and animals grouping [2] Animals were accumulated for 8 weeks after the OVX or sham procedure. Then, animals were grouped into six groups (n = 10) as follow: Group 1: Sham, Group 2: Sham + Cap, Group 3: Sham + Cap + A-779, Group 4: OVX, Group 5: OVX + Cap and Group 6: OVX + Cap + A-779. At the same time, Sham + Cap + A-779 and OVX + Cap + A-779 groups had a subcutaneous implantation of osmotic pumps (model 2006, Alzet, Durect Corporation, Minneapolis, USA) supplying the specific mass receptor antagonist (D-Ala7)-Angiotensin I/II (1–7) trifluoroacetate salt (A-779) at infusion rate 400 ng/kg/min for 6 weeks. Meanwhile, Sham + Cap, Sham + Cap + A-779, OVX + Cap and OVX + Cap + A-779 groups started the oral captopril treatment. Captopril was dissolved in distilled water and administered with gastric gavage in 40 mg kg−1 d−1 dose for 6 weeks. Animals general health and body weights were monitored during the treatment periods and the dose of captopril were weekly adjusted. All groups were provided controlled experimental conditions (temperature 22 ± 1 °C, 12/12 dark and light cycles and humidity 50–55%) as well as a free access to purina rat chow and water ad libitum. At the last day of the sixth week, all groups were located in metabolic cages fastened for 16hr and urine samples were obtained and kept at −70 °C. Blood was collected by cardiac puncture under ketamine and xylazine anesthesia and serum samples were provided at 4000 RPM. Next, the femoral bones samples were removed and cleaned from soft tissues and weighted, then, expressed as grams. The left femoral bone samples were preserved at −70 °C until analyzed, while the right femoral bones were kept in 10% formalin for mico-CT and minerals analysis. Moreover, uterine tissues were excised and cleaned from fats and their weights were measured and expressed as g/100 g final body weight. |
| References |
|
| Additional Infomation |
The local and systemic renin-angiotensin system (RAS) influences the microstructure and metabolism of the skeletal system. Studies have shown that angiotensin 1-7 (Ang(1-7)) exerts beneficial RAS molecular effects by activating Mas receptors. This study investigated the role of Ang(1-7) in bone microstructure and metabolism in an ovariectomized (OVX) rodent model of osteoporosis. OVX rats exhibited structural and metabolic degeneration of bone, with suppressed expression of angiotensin-converting enzyme 2 (ACE-2)/Ang(1-7)/Mas-related components. Infusion of Ang(1-7) significantly improved abnormal bone metabolism and significantly enhanced the morphometric characteristics of trabecular bone (metaphysis) and cortical bone (metaphysis-diaphysis). Ang(1-7) also improved urinary and bone mineral content in OVX rats. In ovariectomized (OVX) animals, infusion of heptapeptide enhanced ACE-2/Mas receptor expression while downregulating the expression of angiotensin II (AngII), angiotensin-converting enzyme (ACE), and angiotensin II type 1 receptor (AT1R). Furthermore, Ang(1-7) significantly increased osteoprotegerin (OPG) levels and decreased nuclear factor κB receptor activator ligand (RANKL) expression. Blocking the Mas receptor with A-779 significantly weakened the protective effects of Ang(1-7) on bone metabolism, structure, and mineralization. A-779 eliminated the Ang(1-7)-induced upregulation of the ACE-2/Ang(1-7)/Mas signaling pathway and OPG expression, and induced the expression of ACE/AngII/AT1R and RANKL. These findings reveal for the first time a novel therapeutic role of Ang(1-7) in bone health and metabolism through the ACE-2/Mas signaling pathway. [1]
In addition to traditional systemic functions, the local effects of the renin-angiotensin system (RAS) have recently been confirmed. Studies have shown that the effector molecule angiotensin II (AngII) can affect bone health, while inhibition of angiotensin-converting enzyme (ACE-1) can maintain these effects. The newly discovered Ang1-7 has a variety of beneficial effects that antagonize AngII. Therefore, this study used an ovariectomized (OVX) rat osteoporosis model to investigate the osteoprotective effect of Ang1-7 mediated by G protein-coupled Mas receptors (ACEI) (captopril). Eight weeks after surgery, rats were orally administered captopril (40 mg/kg/d) and simultaneously received a specific Mas receptor blocker (A-779) via continuous intravenous infusion at a rate of 400 ng/kg/min for 6 weeks. Bone metabolism markers in serum and urine were detected. The mineral concentrations in serum, urine and femur were quantitatively analyzed by inductively coupled plasma mass spectrometry (ICP-MS). Micro-CT was used to analyze the trabecular and cortical morphology of the right distal femur. Finally, the expression of renin-angiotensin system (RAS) peptides, enzymes, and receptors, as well as nuclear factor κB receptor activator ligand (RANKL) and osteoprotegerin (OPG), in the femoral head was measured. Ovarian removal (OVX) animals exhibited significant changes in bone metabolism and mineralization, as well as bone microstructural disturbances. Captopril significantly restored bone metabolism biomarkers in estrogen-deficient rats and corrected urinary and bone Ca2+ and P values. Furthermore, captopril restored the trabecular and cortical morphological characteristics of the OVX group. Captopril also improved the expression of ACE-2, Ang1-7, Mas, and OPG, while eliminating the OVX-induced upregulation of ACE-1, AngII, angiotensin II receptor type 1 (AT1R), and RANKL expression. A-779 significantly eliminated the protective effects of captopril on bone metabolism, mineralization and microstructure by inhibiting the Ang1-7 signaling pathway. A-779 also restored the effects of ovariectomy on RANKL expression and the ACE-1/AngII/AT1R signaling pathway, and downregulated OPG expression and the ACE-2/Ang1-7/Mas signaling pathway. Consistent with the clinical observation results of the osteoprotective properties of ACE-1 inhibitors, local activation of the ACE-2/Ang1-7/Mas signaling pathway and inhibition of osteoclastogenesis seem to be the reasons for the osteoprotective effect of captopril, which may provide potential therapeutic value for the treatment of disabling skeletal and musculoskeletal diseases. [2] Objective: To investigate the role and related mechanisms of angiotensin-(1-7)(Ang-(1-7)) in Toll-like receptor 4 (TLR4)-mediated oxidative low-density lipoprotein (ox-LDL)-induced oxidative stress in human umbilical vein endothelial cells (HUVECs). Methods: Human umbilical vein endothelial cells (HUVECs) were cultured in vitro and divided into six groups: control group (normal culture medium), ox-LDL group (treated with 75 mg/L ox-LDL), ox-LDL+Ang-(1-7) group (pretreated with 1 μmol/L Ang-(1-7) for 30 min, then added with 75 mg/L ox-LDL), ox-LDL+Ang-(1-7)+A-779 group (pretreated with 1 μmol/L A-779 (Mas receptor) for 30 min, pretreated with 1 μmol/L Ang-(1-7) for 30 min, then added with 75 mg/L ox-LDL), ox-LDL+A-779 group (pretreated with 1 μmol/L A-779 for 30 min, then added with 75 mg/L ox-LDL), and ox-LDL+HTA125 group (pretreated with 10 μg/L HTA125). HTA125 (TLR4 blocking antibody) was used to treat cells for 30 minutes, followed by intervention with 75 mg/L ox-LDL. Corresponding indicators were detected 24 hours after intervention. Apoptosis was detected by Annexin V-FITC/PI double staining flow cytometry and TUNEL assay. The generation of reactive oxygen species (ROS), a product of oxidative stress, was detected by DCFH-DA staining. The mRNA and protein expression levels of NADPH oxidase 4 (NOX4) and TLR4 were detected by real-time reverse transcription-polymerase chain reaction (RT-PCR) and Western blotting analysis, respectively. [3] |
| Molecular Formula |
C39H60N12O11
|
|---|---|
| Molecular Weight |
872.96700
|
| Exact Mass |
872.45
|
| Elemental Analysis |
C, 53.66; H, 6.93; N, 19.25; O, 20.16
|
| CAS # |
159432-28-7
|
| PubChem CID |
10169886
|
| Sequence |
Asp-Arg-Val-Tyr-Ile-His-{d-Ala};
H-Asp-Arg-Val-Tyr-Ile-His-D-Ala-OH;
L-alpha-aspartyl-L-arginyl-L-valyl-L-tyrosyl-L-isoleucyl-L-histidyl-D-alanine
|
| SequenceShortening |
DRVYIHA; DRVYIH-{d-Ala}
|
| Appearance |
White to off-white solid powder
|
| Density |
1.5±0.1 g/cm3
|
| Index of Refraction |
1.651
|
| LogP |
0.3
|
| Hydrogen Bond Donor Count |
13
|
| Hydrogen Bond Acceptor Count |
14
|
| Rotatable Bond Count |
26
|
| Heavy Atom Count |
62
|
| Complexity |
1570
|
| Defined Atom Stereocenter Count |
8
|
| SMILES |
CC[C@H](C)[C@@H](C(=O)N[C@@H](CC1=CN=CN1)C(=O)N[C@H](C)C(=O)O)NC(=O)[C@H](CC2=CC=C(C=C2)O)NC(=O)[C@H](C(C)C)NC(=O)[C@H](CCCN=C(N)N)NC(=O)[C@H](CC(=O)O)N
|
| InChi Key |
GZSZZUXDAPDPOR-NGIFJXEWSA-N
|
| InChi Code |
InChI=1S/C39H60N12O11/c1-6-20(4)31(37(60)49-28(15-23-17-43-18-45-23)34(57)46-21(5)38(61)62)51-35(58)27(14-22-9-11-24(52)12-10-22)48-36(59)30(19(2)3)50-33(56)26(8-7-13-44-39(41)42)47-32(55)25(40)16-29(53)54/h9-12,17-21,25-28,30-31,52H,6-8,13-16,40H2,1-5H3,(H,43,45)(H,46,57)(H,47,55)(H,48,59)(H,49,60)(H,50,56)(H,51,58)(H,53,54)(H,61,62)(H4,41,42,44)/t20-,21+,25-,26-,27-,28-,30-,31-/m0/s1
|
| Chemical Name |
(3S)-3-amino-4-[[(2S)-1-[[(2S)-1-[[(2S)-1-[[(2S,3S)-1-[[(2S)-1-[[(1R)-1-carboxyethyl]amino]-3-(1H-imidazol-5-yl)-1-oxopropan-2-yl]amino]-3-methyl-1-oxopentan-2-yl]amino]-3-(4-hydroxyphenyl)-1-oxopropan-2-yl]amino]-3-methyl-1-oxobutan-2-yl]amino]-5-(diaminomethylideneamino)-1-oxopentan-2-yl]amino]-4-oxobutanoic acid
|
| Synonyms |
159432-28-7; A 779; (D-Ala7)-Angiotensin I/II (1-7); A-779; CHEMBL4578721; (2R,5S,8S,11S,14S,17S,20S)-5-((1H-imidazol-4-yl)methyl)-20-amino-8-((S)-sec-butyl)-17-(3-guanidinopropyl)-11-(4-hydroxybenzyl)-14-isopropyl-2-methyl-4,7,10,13,16,19-hexaoxo-3,6,9,12,15,18-hexaazadocosanedioic acid; (3S)-3-amino-4-[[(2S)-1-[[(2S)-1-[[(2S)-1-[[(2S,3S)-1-[[(2S)-1-[[(1R)-1-carboxyethyl]amino]-3-(1H-imidazol-5-yl)-1-oxopropan-2-yl]amino]-3-methyl-1-oxopentan-2-yl]amino]-3-(4-hydroxyphenyl)-1-oxopropan-2-yl]amino]-3-methyl-1-oxobutan-2-yl]amino]-5-(diaminomethylideneamino)-1-oxopentan-2-yl]amino]-4-oxobutanoic acid; Ang(1-7) D-Ala7;
|
| HS Tariff Code |
2934.99.9001
|
| Storage |
Powder -20°C 3 years 4°C 2 years In solvent -80°C 6 months -20°C 1 month Note: Please store this product in a sealed and protected environment, avoid exposure to moisture. |
| Shipping Condition |
Room temperature (This product is stable at ambient temperature for a few days during ordinary shipping and time spent in Customs)
|
| Solubility (In Vitro) |
0.1 M HCL : 25 mg/mL (~28.64 mM)
H2O : ~5 mg/mL (~5.73 mM) |
|---|---|
| Solubility (In Vivo) |
Note: Listed below are some common formulations that may be used to formulate products with low water solubility (e.g. < 1 mg/mL), you may test these formulations using a minute amount of products to avoid loss of samples.
Injection Formulations
Injection Formulation 1: DMSO : Tween 80: Saline = 10 : 5 : 85 (i.e. 100 μL DMSO stock solution → 50 μL Tween 80 → 850 μL Saline)(e.g. IP/IV/IM/SC) *Preparation of saline: Dissolve 0.9 g of sodium chloride in 100 mL ddH ₂ O to obtain a clear solution. Injection Formulation 2: DMSO : PEG300 :Tween 80 : Saline = 10 : 40 : 5 : 45 (i.e. 100 μL DMSO → 400 μLPEG300 → 50 μL Tween 80 → 450 μL Saline) Injection Formulation 3: DMSO : Corn oil = 10 : 90 (i.e. 100 μL DMSO → 900 μL Corn oil) Example: Take the Injection Formulation 3 (DMSO : Corn oil = 10 : 90) as an example, if 1 mL of 2.5 mg/mL working solution is to be prepared, you can take 100 μL 25 mg/mL DMSO stock solution and add to 900 μL corn oil, mix well to obtain a clear or suspension solution (2.5 mg/mL, ready for use in animals). View More
Injection Formulation 4: DMSO : 20% SBE-β-CD in saline = 10 : 90 [i.e. 100 μL DMSO → 900 μL (20% SBE-β-CD in saline)] Oral Formulations
Oral Formulation 1: Suspend in 0.5% CMC Na (carboxymethylcellulose sodium) Oral Formulation 2: Suspend in 0.5% Carboxymethyl cellulose Example: Take the Oral Formulation 1 (Suspend in 0.5% CMC Na) as an example, if 100 mL of 2.5 mg/mL working solution is to be prepared, you can first prepare 0.5% CMC Na solution by measuring 0.5 g CMC Na and dissolve it in 100 mL ddH2O to obtain a clear solution; then add 250 mg of the product to 100 mL 0.5% CMC Na solution, to make the suspension solution (2.5 mg/mL, ready for use in animals). View More
Oral Formulation 3: Dissolved in PEG400 (Please use freshly prepared in vivo formulations for optimal results.) |
| Preparing Stock Solutions | 1 mg | 5 mg | 10 mg | |
| 1 mM | 1.1455 mL | 5.7276 mL | 11.4551 mL | |
| 5 mM | 0.2291 mL | 1.1455 mL | 2.2910 mL | |
| 10 mM | 0.1146 mL | 0.5728 mL | 1.1455 mL |
*Note: Please select an appropriate solvent for the preparation of stock solution based on your experiment needs. For most products, DMSO can be used for preparing stock solutions (e.g. 5 mM, 10 mM, or 20 mM concentration); some products with high aqueous solubility may be dissolved in water directly. Solubility information is available at the above Solubility Data section. Once the stock solution is prepared, aliquot it to routine usage volumes and store at -20°C or -80°C. Avoid repeated freeze and thaw cycles.
Calculation results
Working concentration: mg/mL;
Method for preparing DMSO stock solution: mg drug pre-dissolved in μL DMSO (stock solution concentration mg/mL). Please contact us first if the concentration exceeds the DMSO solubility of the batch of drug.
Method for preparing in vivo formulation::Take μL DMSO stock solution, next add μL PEG300, mix and clarify, next addμL Tween 80, mix and clarify, next add μL ddH2O,mix and clarify.
(1) Please be sure that the solution is clear before the addition of next solvent. Dissolution methods like vortex, ultrasound or warming and heat may be used to aid dissolving.
(2) Be sure to add the solvent(s) in order.
| NCT Number | Recruitment | interventions | Conditions | Sponsor/Collaborators | Start Date | Phases |
| NCT05786729 | Enrolling by invitation | Other: Aerobic Exercise (AER) Other: Rehabilitation |
Traumatic Brain Injury | Centre for Neuro Skills | January 18, 2022 | Phase 1 Phase 2 |
|
|
|
Products are for research use only; We do not sell to patients
Copyright 2020 InvivoChem LLC | All Rights Reserved