| Size | Price | Stock | Qty |
|---|---|---|---|
| 5mg |
|
||
| 10mg |
|
||
| 25mg |
|
||
| 50mg |
|
||
| 100mg |
|
||
| 250mg |
|
||
| Other Sizes |


Purity: ≥98%
| Targets |
MOR ( EC50 = 97 nM )
μ-Opioid Receptor (μOR) (Ki = 14 nM; EC₅₀ for G protein activation = 31 nM; EC₅₀ for β-arrestin 2 recruitment = 144 nM; Bias Factor = 17 [G protein/β-arrestin 2]) [1] |
|---|---|
| ln Vitro |
In vitro activity: SR17018 is a GTPγS-binding mu-opioid receptor (MOR) agonist with an EC50 of 97 nM. At less than 10 μM, SR17018 does not appear to have any discernible effect on βarrestin2 recruitment to the MOR. SR17018 facilitates signaling via βarrestin2 or G proteins[1].
SR17018 is a G protein-biased μOR agonist with high selectivity for μOR over δ-opioid receptor (δOR) and κ-opioid receptor (κOR) (Ki values for δOR and κOR not provided) [1] In G protein activation assays (using [³⁵S]GTPγS binding), SR17018 exhibits an EC₅₀ of 31 nM, with a maximal response (Emax) of ~80% relative to the full agonist DAMGO [1] In β-arrestin 2 recruitment assays (PathHunter assay), SR17018 shows reduced efficacy, with an EC₅₀ of 144 nM and an Emax of ~30% relative to DAMGO, resulting in a bias factor of 17 (favoring G protein signaling) [1] SR17018 inhibits forskolin-stimulated cAMP accumulation in μOR-expressing CHO cells in a dose-dependent manner (EC₅₀ = 42 nM), consistent with Gαi/o pathway activation [1] In human embryonic kidney (HEK293) cells stably expressing μOR, SR17018 induces internalization of μOR to a lesser extent than DAMGO; flow cytometry analysis shows ~20% internalization at 1 μM (vs ~80% for DAMGO) [1] Pretreatment of μOR-expressing cells with SR17018 (1 μM, 30 min) does not significantly desensitize μOR-mediated G protein signaling, whereas DAMGO (1 μM, 30 min) causes marked desensitization (remaining activity: ~70% for SR17018 vs ~30% for DAMGO) [1] |
| ln Vivo |
Using intraperitoneal dosing, pharmacokinetic parameters were ascertained in C57BL/6J mice. Using conventional centrifugation methods, approximately 10 μL of plasma were produced, which were then frozen right away. Mice were killed by cervical dislocation for brain collection, after which the brains were removed and cryopreserved in liquid nitrogen. Using multiple reaction monitoring techniques, drug levels were ascertained using an LC (Shimadzu)-tandem mass spectrometer (AB Sciex) operating in positive-ion mode (Brust et al., 2016). Using Rapid Equilibrium Dialysis (RED) equipment (ThermoFisher), the plasma protein binding for morphine and fentanyl was ascertained. For the SR compounds, 900 μL of plasma samples (0.5 mL at 0.5 μM test compound) were put into a 2 mL polycarbonate ultracentrifuge tube with a stopper. The material was subjected to a two-hour centrifugation at 400,000 x g using a TLA 120.2 rotor maintained at 25°C and a Beckman Coulter Optima Max ultracentrifuge (130,000 RPM max). Three layers emerge from the centrifuged material. Most of the albumin is found in the easily visible, protein-rich bottom layer. Though more difficult to see, the top layer is rich in lipoproteins. With the conditions mentioned, the middle layer (1-2 mm below the surface) has very low protein concentrations and can be used to calculate the amount of unbound drug. By comparing the compound concentration in the middle layer of the centrifuged sample to the concentration of a parallel sample that was not centrifuged, LC-MS/MS was able to calculate the percent unbound compound.
In the mouse hot plate test (thermal pain model), SR17018 induces dose-dependent antinociception after subcutaneous (s.c.) administration, with an ED₅₀ of 1.2 mg/kg; the antinociceptive effect is blocked by the μOR-selective antagonist naloxone (1 mg/kg, s.c.) [1] In the mouse tail flick test (nociceptive reflex model), SR17018 (0.3–3 mg/kg, s.c.) produces dose-dependent antinociception, with a maximal effect comparable to DAMGO (10 mg/kg, s.c.) [1] SR17018 (3 mg/kg, s.c.) does not induce significant respiratory depression in mice (measured by whole-body plethysmography), whereas DAMGO (10 mg/kg, s.c.) causes a 40% reduction in minute ventilation [1] In the mouse conditioned place preference (CPP) assay (reward-seeking behavior model), SR17018 (1–10 mg/kg, s.c.) does not produce significant CPP, in contrast to DAMGO (5 mg/kg, s.c.) which induces robust CPP [1] SR17018 (3 mg/kg, s.c.) does not cause significant constipation in mice (measured by fecal pellet output over 24 h), whereas DAMGO (10 mg/kg, s.c.) reduces fecal output by ~60% [1] Chronic administration of SR17018 (3 mg/kg, s.c., once daily for 7 days) in mice does not induce tolerance to its antinociceptive effect (hot plate test); in contrast, DAMGO (10 mg/kg, s.c., once daily for 7 days) shows significant tolerance (ED₅₀ increased by ~3-fold) [1] Withdrawal symptoms (jumping, paw tremors) are not observed in mice after naloxone-precipitated withdrawal (10 mg/kg, s.c.) following chronic SR17018 administration, whereas DAMGO-treated mice exhibit robust withdrawal responses [1] |
| Enzyme Assay |
A commercial enzyme fragment complementation assay (β-galactosidase) was utilized to ascertain the recruitment of βarrestin2 to the human MOR. Prior to measuring the signal, U2OS-βarrestin-hMOR PathHunter cells were plated in Assay Complete Cell Plating 5 Reagent in a 384-well, white-walled assay microplate at a density of 5,000 cells per well 16–20 hours earlier. βarrestin2 recruitment was assessed using the PathHunter Detection Kit with the β-galactosidase substrate to detect functional β-galactosidas after cells were treated for 90 minutes at 37°C with increasing concentrations of test compounds. A SpectraMax M5e Microplate Reader was used to measure the increase in luminescence that resulted. For the PathHunter U2OS OPRM1 βarrestin cells, the average vehicle was 446 ± 25 RLU, while the average fold over vehicle for DAMGO was 36 ± 1.
Saturation and competition radioligand binding [1] \Receptor binding assays were performed on CHO-hMOR, CHO-hDOR and CHO-hKOR cell lines as previously described (Groer et al., 2011; Schmid et al., 2013). Cells were serum-starved for 30 minutes, cells were collected and membrane pellets were prepared by Teflon-on-glass dounce homogenization in membrane buffer containing (50 mM Tris-HCl, pH 7.4, 100 mM NaCl, 1 mM EDTA), followed by centrifugation at 20,000 x g for 30 minutes at 4 °C. Membranes were resuspended in assay buffer (10 mM Tris-HCl, pH 7.4, 100 mM NaCl). Binding reactions (200 μl volume) were performed on 10 μg membranes with the appropriate radioligand (MOR, 3H-DAMGO; KOR, 3H-U69,593; DOR, 3H-diprenorphine) for 2 hours at 25 °C. For competition experiments, the concentration of each of the radioligands was approximately 1 nM (0.96–1.10 nM 3H-DAMGO; 1.06–1.19 nM 3H-U69,593; 0.92–0.98 nM 3H-diprenorphine). Nonspecific binding was determined in the presence of 10 μM DAMGO (MOR), 10 μM U69,593 (KOR) or 10 μM Naloxone (DOR). Reactions were terminated by filtration through GF/B glass fiber filter plates, which had been pre-incubated with 0.1% polyethyleneimine, on a Brandel cell harvester. Radioactivity was counted with Microscint on a TopCount NXT Scintillation Counter. Saturation binding assays and hyperbolic curve fitting of specific binding was used to determine radioligand binding affinities and receptor numbers for the CHO cell lines (hMOR, 1.02 ± 0.10 nM for 3H-DAMGO and 1.58 ± 0.11 pmol/mg; hDOR, 0.70 ± 0.11 nM [3H]-Diprenorphine and 1.46 ± 0.26 pmol/mg; hKOR, 1.07 ± 0.01 nM [3H]-U69,593 and 0.71 ± 0.12 pmol/mg). 35S-GTPγS binding to membranes [1] \35S-GTPγS binding was determined in membranes prepared from CHO-hMOR and CHO-mMOR cells and brainstems isolated from adult male C57BL/6J and MOR-KO mice as described previously (Schmid et al., 2013). CHO-hMOR and CHO-mMOR cellular membranes, collected and prepared as described above with in GTPγS binding membrane buffer (10 mM Tris-HCl, pH 7.4, 100 mM NaCl, 1 mM EDTA). Reactions (200 μl volume) were performed for 1 hour at 25 °C on 10 μg membranes suspended in assay buffer (50 mM Tris-Cl, pH 7.4, 100 mM NaCl, 5 mM MgCl2, 1 mM EDTA) with 50 μM Guanosine-5”-diphosphate (GDP) and 0.1 nM 35S-GTPγS. Reactions were terminated by filtration through GF/B filter plates and radioactivity was counted as described above. For [35S]-GTPγS binding on brainstems isolated from C57BL/6J and MOR-KO mice, tissues were homogenized by polytronic tissue tearor and membranes were prepared as described above. Binding reactions, containing 2.5 μg protein, 1 mM dithiothreitol (DTT), 20 μM GPD and 0.1 nM 35S-GTPγS, were incubated at room temperature for 2 hours prior to harvesting. The average vehicle value for the CHO-hMOR membranes was 786 ± 78 cpm and the average fold over vehicle for DAMGO was 4.6± 0.26. The average vehicle value for the CHO-mMOR cell membranes was 694 ± 28 cpm and the average fold over vehicle for DAMGO was 5.9 ± 0.57. The average vehicle for the C57BL/6J brainstem membranes was 657 ± 62 cpm and the average fold over vehicle for DAMGO was 1.9 ± 0.03. The average vehicle for the MOR-KO brainstem membranes was 1647 ± 507 cpm. \βArrestin2 recruitment assays [1] \To determine βarrestin2 recruitment to the human MOR a commercial enzyme fragment complementation assay (β-galactosidase) was used. U2OS-βarrestin-hMOR PathHunter® cells were plated at a density of 5,000 cells per well of a 384-well, white-walled assay microplate in Assay Complete Cell Plating 5 Reagent 16–20 hours prior to measuring the signal. Cells were treated for 90 minutes with increasing concentrations of test compounds at 37 °C and βarrestin2 recruitment was determined using the PathHunter® Detection Kit with the β-galactosidase substrate to detect functional β-galactosidas. The resulting increase in luminescence was measured using a SpectraMax M5e Microplate Reader. The average vehicle for the PathHunter U2OS OPRM1 βarrestin cells was 446 ± 25 RLU and the average fold over vehicle for DAMGO was 36 ± 1.\ \To determine βarrestin2 recruitment to the mMOR, an imaging-based assay as was used (Zhou et al., 2013). U2OS-βarrestin2-GFP-mMOR cells were plated at a density of 5,000 cells per well of a 384-well, black-walled, clear-bottom optical imaging microplate (Brooks) in normal media 16–20 hours prior to assaying. Cells were serum-starved for 1 hour and then treated with increasing concentrations of test compounds for 20 minutes at 37 °C. Cells were fixed with 4% paraformaldehyde (PFA) containing Hoechst nuclear stain at a dilution of 1:1000. βArrestin 2 translocation was measured using the 20X objective on a CellInsight CX5 High Content Screening Platform. Punctae (normalized to Hoechst stain) were quantified using the Cellomics’ Spot Detection BioApplication. The average punctae / Hoechst ratio for vehicle treated U2OS-βarrestin2-GFP-mMOR cells was 2.2 ± 0.54 and the average fold over vehicle for DAMGO was 61 ± 13.\ \To determine whether the compounds have activity at NOP, βarrestin2 recruitment to the receptor was determined in the U2OS-Tango-hOPRL1-bla cells. U2OS-Tango-hOPRL1-bla cells were plated at a density of 10,000 cells per well of a 384-well, black-walled, clear-bottom assay plate in 32 μl assay media (DMEM + 10% dialyzed FBS, 0.1 mM NEAA, 25 mM HEPES and 1% pen/strep) 16–20 hours prior to assaying. Cells were treated with increasing concentrations of test compounds for 5 hours at 37 °C. NOP activation was determined using the LiveBLAzer FRET-B/G loading kit with Solution D, according to the manufacturer’s protocol. FRET signal (excitation 409 nm, emissions at 460 nm and 530 nm) was measured using a SpectraMax M5e Microplate Reader. The average 460/530 ratio vehicle treated U2OS-Tango-hOPRL1-bla cells was 0.31 ± 0.03 and the average fold over vehicle for nociceptin was 7.6 ± 0.68. Perform radioligand binding assays using [³H]DAMGO as the radioligand to determine the Ki value of SR17018 for μOR; incubate membrane preparations from μOR-expressing cells with increasing concentrations of SR17018 and a fixed concentration of [³H]DAMGO (0.5 nM) for 90 min at 25°C; separate bound and free ligand by filtration, and measure radioactivity to calculate Ki using nonlinear regression [1] Conduct [³⁵S]GTPγS binding assays to evaluate G protein activation: incubate μOR-expressing cell membranes with SR17018 (10 pM–10 μM) and [³⁵S]GTPγS (0.1 nM) in the presence of GDP (10 μM) for 60 min at 30°C; filter through GF/B filters, wash, and quantify bound radioactivity to determine EC₅₀ and Emax [1] Perform β-arrestin 2 recruitment assays using the PathHunter system: seed HEK293 cells stably expressing μOR (tagged with ProLink) and β-arrestin 2 (tagged with Enzyme Acceptor) in 384-well plates; treat with SR17018 (10 pM–10 μM) for 90 min at 37°C; add substrate, incubate for 60 min, and measure chemiluminescence to calculate EC₅₀ and Emax [1] |
| Cell Assay |
cAMP accumumlation assay [1]
The CHO-hMOR, -hDOR, and -hKOR cells were seeded at a density of 4,000 cells per well in Opti-MEM containing 1% FBS in a 384-well, white-walled, 30 μl-volume microplate (Greiner Bio-One) four hours before the assay. 20 μM forskolin, 25 μM 4-(3-Butoxy-4-methoxybenzyl)imidazolidin-2-one (Ro-20-1724), and escalating concentrations of test compounds were applied to the cells for 30 minutes at 25°C. Next, we used Cisbio's Homogeneous Time-Resolved Fluorescence resonance energy transfer (FRET) cAMP HiRange assay (Cisbio-62AM6PEC) to measure the inhibition of cAMP. At 620 and 665 nm, fluorescence was measured with a PerkinElmer Envision Multilabel Reader. The formula for calculating FRET was 665 nm / 620 nm. For CHO-hMOR cells, the average vehicle ratio was 3134 ± 99, while for DAMGO, the average fold over vehicle was 2.2 ± 0.04. For CHO-hDOR cells, the average vehicle ratio was 2962 ± 181, and for SNC80, the average fold over vehicle was 1.6 ± 0.04. For CHO-hKOR cells, the average vehicle ratio was 2965 ± 153, and for U69,593, the average fold over vehicle was 1.9 ± 0.12. Measure cAMP accumulation in μOR-expressing CHO cells: seed cells in 96-well plates, incubate overnight, pretreat with SR17018 (10 pM–10 μM) for 30 min, add forskolin (10 μM) for 15 min; lyse cells, and quantify cAMP levels using a competitive ELISA kit to determine EC₅₀ [1] Assess μOR internalization by flow cytometry: label μOR-expressing HEK293 cells with a fluorescently conjugated μOR-specific antibody, treat with SR17018 (1 μM) or DAMGO (1 μM) for 30 min at 37°C; wash cells, fix, and analyze fluorescence intensity using flow cytometry to quantify internalization percentage [1] Evaluate receptor desensitization: pretreat μOR-expressing cells with SR17018 (1 μM) or DAMGO (1 μM) for 30 min, wash, and stimulate with a submaximal concentration of DAMGO (100 nM); measure [³⁵S]GTPγS binding to assess remaining G protein signaling activity [1] |
| Animal Protocol |
C57BL/6J mice:Pharmacokinetics and plasma protein binding [1]
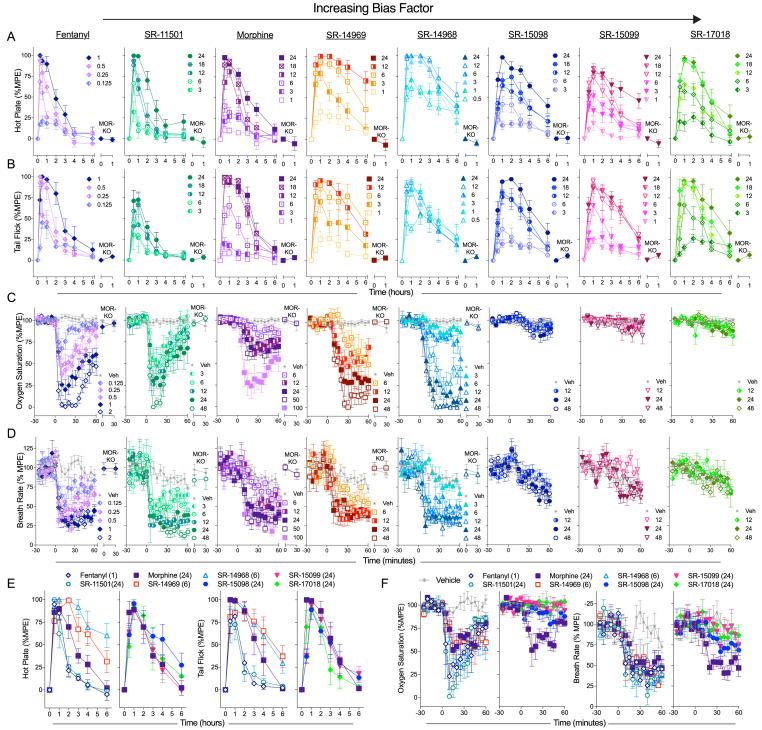
Pharmacokinetic parameters were determined in the C57BL/6J mice by i.p. dosing. Plasma was generated by standard centrifugation techniques, resulting in ~10 μl of plasma that was immediately frozen. For brain collection, mice were sacrificed by cervical dislocation and brains were isolated and flash frozen in liquid nitrogen. Drug levels were determined using a LC (Shimadzu)-tandem mass spectrometry operated in positive-ion mode using multiple reaction monitoring methods (Brust et al., 2016). Plasma protein binding for fentanyl and morphine was determined using Rapid Equilibrium Dialysis (RED) devices. For the SR compounds, plasma samples (0.5 mL at 0.5 μM test compound) were prepared and 900 μl was transferred to a 2 mL polycarbonate ultracentrifuge tube. The sample was centrifuged at 400,000 x g for two hours using a Beckman Coulter Optima Max ultracentrifuge (130,000 RPM max) with a TLA 120.2 rotor held at 25°C. The centrifuged sample separates into three layers. The protein-rich bottom layer contains most of the albumin and is easily visualized. The top layer is not as easily discerned, but contains a high concentration of lipoproteins. The middle layer (1–2 mm below surface using the described conditions) has very low protein concentrations and can be used to determine the amount of unbound drug. The percent unbound compound was determined by LC-MS/MS by comparison of the compound concentration in the middle layer of the centrifuged sample to the concentration of a parallel sample that did not undergo centrifugation (Kieltyka et al., 2016). Antinociception [1] Antinociceptive responses to thermal stimuli were determined according to previously published protocols (Bohn et al., 1999; Raehal, 2011). Basal nociceptive responses were determined by measuring the amount of time until a mouse rapidly flicked its tail when placed into a 49 °C water bath (tail flick test) or until it licked or flicked its fore- or hind-paws when placed on a to a 52 °C hot plate (hot plate test). Baseline response latencies averaged 2.95 ± 0.07 seconds (tail flick) and 6.17 ± 0.06 seconds (hot plate) for C57BL/6J male mice, 2.34 ± 0.18 seconds (tail flick) and 6.78 ± 0.14 seconds (hot plate) for C57BL/6J female mice and 2.29 ± 0.12 seconds (tail flick) and 6.54 ± 0.17 seconds (hot plate) for MOR-KO male mice. Antinociceptive responses were determined at the indicated time points over the course of 6 hours immediately following injection. To minimize tissue damage, maximum response latencies were limited to 30 and 20 seconds for tail flick and hot plate assays, respectively. Data are presented as “% maximum possible effect” which was calculated by (response latency – baseline) / (maximal response cutoff latency – baseline) * 100. Respiration [1] A MouseOx Plus® pulse oximeter was used to monitor mouse vital signs following drug treatment. Two days prior to testing, mice were shaved around the neck and habituated to the oximeter collars and 50 ml conical tubes that had been modified to restrain mice during testing. Mice were again habituated to the collars and conical tubes one day prior to testing. On the testing day, mice were fit with collars and returned to the conical tubes and basal vital signs were monitored for 30 minutes; mice were then immediately injected with drug and vital signs were monitored for an additional hour. Raw data were averaged into 5 minute bins. The average baseline responses (average over first 30 minutes) for C57BL/6J male mice were 95.11 ± 0.12 % (% oxygen saturation) and 165.0 ± 0.2 bpm (breath rate). The average baseline responses for C57BL/6J female mice were 96.30 ± 0.32 % (% oxygen saturation) and 150.1 ± 1.6 bpm (breath rate). The average baseline responses for MOR-KO male mice were 94.14 ± 0.38 % (% oxygen saturation) and 156.6 ± 2.5 bpm (breath rate). Data are presented as “% maximum possible effect” which was calculated by (response – average baseline) / (maximal response cutoff – average baseline) * 100. The maximum responses cutoff for % oxygen saturation and breath rate were set at 70% O2 and 75 breaths per minute (brpm), respectively. Conduct the hot plate test: acclimate mice to the hot plate (55°C) for 3 days, administer SR17018 (0.1–10 mg/kg, s.c.) or vehicle, measure paw withdrawal latency at 15, 30, 60, and 120 min post-administration; for antagonist studies, pretreat with naloxone (1 mg/kg, s.c.) 15 min before SR17018 [1] Perform the tail flick test: immobilize mice, expose the tail to a radiant heat source, measure tail flick latency before and after administration of SR17018 (0.3–3 mg/kg, s.c.) or DAMGO (10 mg/kg, s.c.) [1] Assess respiratory function: place mice in whole-body plethysmography chambers, acclimate for 30 min, administer SR17018 (3 mg/kg, s.c.) or DAMGO (10 mg/kg, s.c.), and record minute ventilation, tidal volume, and respiratory rate for 2 h [1] Conduct the CPP assay: habituate mice to the CPP apparatus (two distinct compartments) for 3 days, administer SR17018 (1–10 mg/kg, s.c.) or DAMGO (5 mg/kg, s.c.) and place in one compartment for 45 min (paired), administer vehicle and place in the other compartment (unpaired) for 4 days; on test day, measure time spent in each compartment without drug [1] Evaluate constipation: house mice individually, administer SR17018 (3 mg/kg, s.c.) or DAMGO (10 mg/kg, s.c.), collect fecal pellets over 24 h, and count and weigh pellets [1] Induce chronic tolerance: administer SR17018 (3 mg/kg, s.c.) or DAMGO (10 mg/kg, s.c.) once daily for 7 days; on day 8, perform the hot plate test to determine ED₅₀ values and compare to baseline [1] Assess withdrawal symptoms: after 7 days of chronic administration, inject naloxone (10 mg/kg, s.c.), place mice in observation cages, and count jumping and paw tremors for 30 min [1] |
| Toxicity/Toxicokinetics |
SR17018 did not cause significant respiratory depression, constipation, or reward-seeking behavior in mice at analgesic doses [1]. Long-term use of SR17018 did not induce tolerance or withdrawal symptoms in mice [1].
|
| References | |
| Additional Infomation |
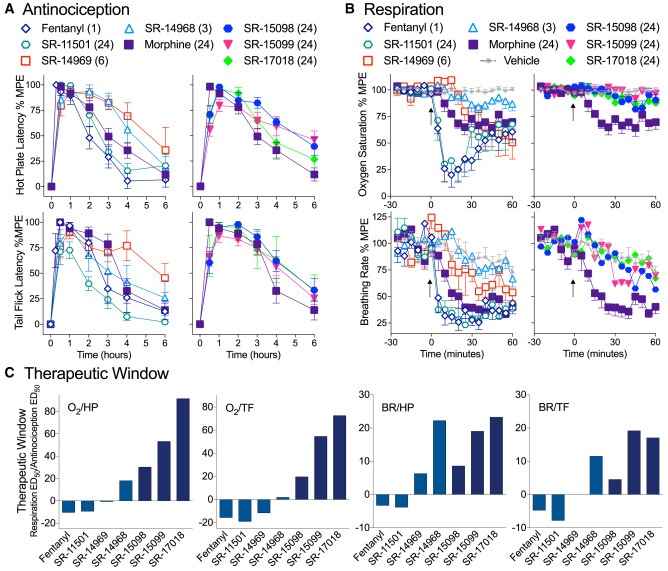
Biased agonists are considered a way to differentiate between beneficial and adverse responses to drugs downstream of G protein-coupled receptor (GPCR) targets. This paper describes the structural characterization of a series of μ-opioid receptor (MOR) selective agonists that preferentially activate receptors to couple with G proteins or recruit β-arrestin proteins. By comparing the relative bias of MOR-mediated signaling in various pathways, we demonstrated a strong correlation between a series of compounds in the therapeutic window of respiratory depression and nociceptive responses, covering a wide range of signal biases. We found that β-arrestin-biased compounds (e.g., fentanyl) were more likely to induce respiratory depression at low analgesic doses, while G protein signal bias broadened the therapeutic window, enabling analgesia without inducing respiratory depression. [1]
Despite these limitations, this study is the first to systematically evaluate the bias of a series of agonists in the detection of multiple signaling pathways and to provide a comprehensive analysis of behavioral responses in a dose-dependent manner. The observed correlation between bias and therapeutic window width is of great significance for predicting the efficacy of the mouse model used in this study using these signaling pathways. In addition, we have demonstrated that signal transduction between different detection methods in cell culture can be modulated by clever modification of key regions of the chemical backbone, and this modulation also manifests as efficacy differences in vivo. Finally, this study introduces a series of novel G protein signaling bias MOR agonists that have achieved the highest separation between respiratory depression and analgesia reported to date in rodent models. We hope that this study will help develop safer alternative therapies than existing opioids. [1] SR17018 is a synthetic G protein bias μ opioid receptor agonist designed to distinguish analgesia from opioid-related adverse reactions (respiratory depression, addiction, constipation). [1] Its bias in G protein signaling (rather than β-arrestin 2 recruitment) is associated with receptor internalization, desensitization and reduced tolerance, as well as a reduction in adverse reactions. [1] The bias factor (17) of SR17018 is associated with a wider therapeutic window, as reflected in the separation between analgesic efficacy and adverse reaction thresholds. [1] Preclinical evidence provided by SR17018 suggests that μ-opioid receptor agonists with high G protein bias may serve as safer opioid analgesics, reducing the risk of abuse and side effects. [1] |
| Molecular Formula |
C₁₉H₁₈CL₃N₃O
|
|
|---|---|---|
| Molecular Weight |
410.72
|
|
| Exact Mass |
409.05
|
|
| Elemental Analysis |
C, 55.56; H, 4.42; Cl, 25.89; N, 10.23; O, 3.90
|
|
| CAS # |
2134602-45-0
|
|
| Related CAS # |
|
|
| PubChem CID |
130431397
|
|
| Appearance |
White to off-white solid powder
|
|
| LogP |
4.7
|
|
| Hydrogen Bond Donor Count |
1
|
|
| Hydrogen Bond Acceptor Count |
2
|
|
| Rotatable Bond Count |
3
|
|
| Heavy Atom Count |
26
|
|
| Complexity |
506
|
|
| Defined Atom Stereocenter Count |
0
|
|
| SMILES |
O=C1NC2=CC(Cl)=C(Cl)C=C2N1C3CCN(CC4=CC=C(Cl)C=C4)CC3
|
|
| InChi Key |
LAGUDYUGRSQDKS-UHFFFAOYSA-N
|
|
| InChi Code |
InChI=1S/C19H18Cl3N3O/c20-13-3-1-12(2-4-13)11-24-7-5-14(6-8-24)25-18-10-16(22)15(21)9-17(18)23-19(25)26/h1-4,9-10,14H,5-8,11H2,(H,23,26)
|
|
| Chemical Name |
5,6-dichloro-3-[1-[(4-chlorophenyl)methyl]piperidin-4-yl]-1H-benzimidazol-2-one
|
|
| Synonyms |
|
|
| HS Tariff Code |
2934.99.9001
|
|
| Storage |
Powder -20°C 3 years 4°C 2 years In solvent -80°C 6 months -20°C 1 month |
|
| Shipping Condition |
Room temperature (This product is stable at ambient temperature for a few days during ordinary shipping and time spent in Customs)
|
| Solubility (In Vitro) |
|
|||
|---|---|---|---|---|
| Solubility (In Vivo) |
Solubility in Formulation 1: ≥ 1.25 mg/mL (3.04 mM) (saturation unknown) in 10% DMSO + 40% PEG300 + 5% Tween80 + 45% Saline (add these co-solvents sequentially from left to right, and one by one), clear solution.
For example, if 1 mL of working solution is to be prepared, you can add 100 μL of 12.5 mg/mL clear DMSO stock solution to 400 μL PEG300 and mix evenly; then add 50 μL Tween-80 to the above solution and mix evenly; then add 450 μL normal saline to adjust the volume to 1 mL. Preparation of saline: Dissolve 0.9 g of sodium chloride in 100 mL ddH₂ O to obtain a clear solution. Solubility in Formulation 2: ≥ 1.25 mg/mL (3.04 mM) (saturation unknown) in 10% DMSO + 90% Corn Oil (add these co-solvents sequentially from left to right, and one by one), clear solution. For example, if 1 mL of working solution is to be prepared, you can add 100 μL of 12.5 mg/mL clear DMSO stock solution to 900 μL of corn oil and mix evenly. (Please use freshly prepared in vivo formulations for optimal results.) |
| Preparing Stock Solutions | 1 mg | 5 mg | 10 mg | |
| 1 mM | 2.4347 mL | 12.1737 mL | 24.3475 mL | |
| 5 mM | 0.4869 mL | 2.4347 mL | 4.8695 mL | |
| 10 mM | 0.2435 mL | 1.2174 mL | 2.4347 mL |
*Note: Please select an appropriate solvent for the preparation of stock solution based on your experiment needs. For most products, DMSO can be used for preparing stock solutions (e.g. 5 mM, 10 mM, or 20 mM concentration); some products with high aqueous solubility may be dissolved in water directly. Solubility information is available at the above Solubility Data section. Once the stock solution is prepared, aliquot it to routine usage volumes and store at -20°C or -80°C. Avoid repeated freeze and thaw cycles.
Calculation results
Working concentration: mg/mL;
Method for preparing DMSO stock solution: mg drug pre-dissolved in μL DMSO (stock solution concentration mg/mL). Please contact us first if the concentration exceeds the DMSO solubility of the batch of drug.
Method for preparing in vivo formulation::Take μL DMSO stock solution, next add μL PEG300, mix and clarify, next addμL Tween 80, mix and clarify, next add μL ddH2O,mix and clarify.
(1) Please be sure that the solution is clear before the addition of next solvent. Dissolution methods like vortex, ultrasound or warming and heat may be used to aid dissolving.
(2) Be sure to add the solvent(s) in order.
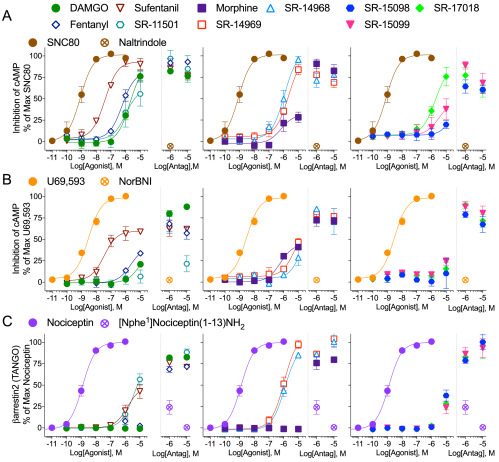
Functional Effects of MOR Agonists at the Human DOR, KOR, and NOP. |
|---|
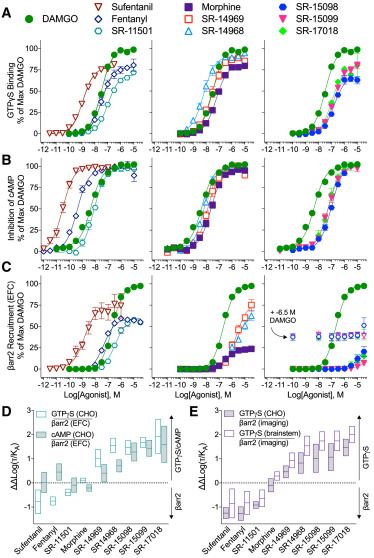
SR Compounds Are Potent Activators of GTPγS Binding but Have Differential βARRESTIN2 Signaling Profiles at the Human MOR. |
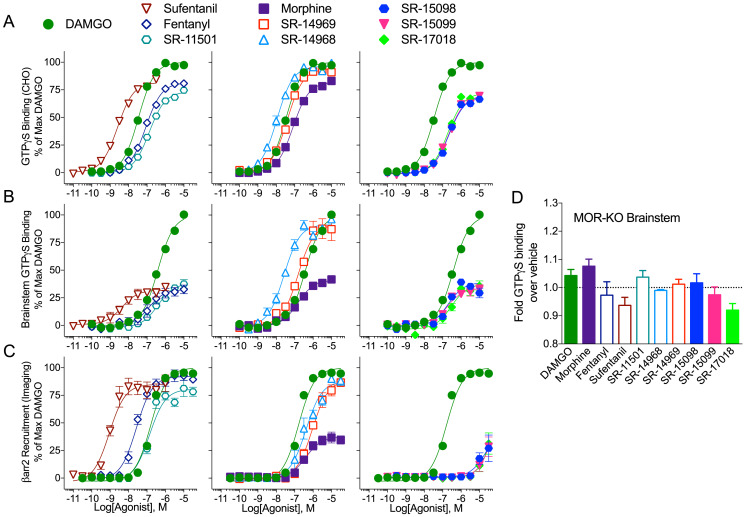
GTPγS Binding at Mouse MOR Expressed in CHO Cells and Mouse Brainstem Compared to βArrestin2 Recruitment to Mouse MOR. |
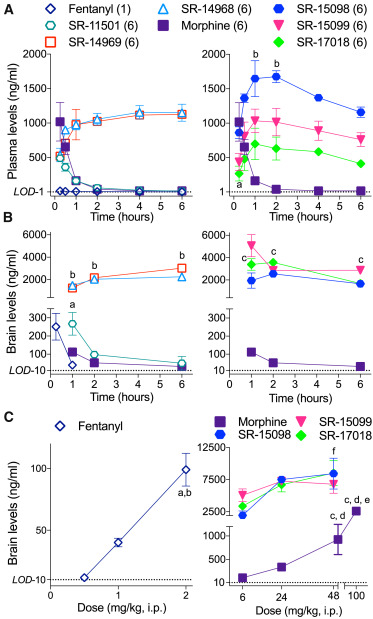
SR Agonists Cross the Blood Brain Barrier and Are Present in Plasma 6 hr after Injection. |
|---|
Agonists That Displayed G Protein-Signaling Bias in the Cell-Based Assays Promote Antincocicpetion with Less Respiratory Suppression. |
Dose Response for the Fentanyl, Morphine, and the SR Compounds in the Antinociception and Respiratory Assays and Efficacy in Female Mice. |
Products are for research use only; We do not sell to patients
Copyright 2020 InvivoChem LLC | All Rights Reserved


 COA
COA