| Size | Price | Stock | Qty |
|---|---|---|---|
| 5mg |
|
||
| 10mg |
|
||
| 25mg |
|
||
| 50mg |
|
||
| 100mg |
|
||
| 250mg |
|
||
| Other Sizes |
Purity: ≥98%
Fluorofenidone (AKF-PD; AKFPD), a derivative of AMR69, is a promising multifunctional antifibrosis pyridinone drug that inhibits the pathogenesis of renal interstitial fibrosis by acting as a potent inhibitor of nicotinamide adeninedinucleotide phosphate oxidase via the PI3K/Akt pathway. It slows the development of renal interstitial fibrosis in part by inhibiting NADPH oxidase and the deposition of extracellular matrix (ECM) through the PI3K/Akt signaling pathway.
| Targets |
PI3K/Akt
|
|---|---|
| ln Vitro |
AKF-PD/Fluorofenidone inhibited Ang II-induced collagen I (α1) expression in rat NRK-52E cells [1]
Pretreatment with Ang II also increased the protein expression of collagen I (α1) which was attenuated at a similar rate by both AKF-PD and Losartan treatment (P < 0.05) (Fig. 4B). AKF-PD/Fluorofenidone inhibited ROS formation in Ang II-induced rat proximal tubular epithelial (NRK-52E) cells [1] Experiments were first carried out to determine the time course of ROS generation by Ang II stimulated rat NRK-52E cells by measuring DCF-emitted fluorescence (Fig. 3A). Ang II-induced ROS generation was increased at 60 min. Then, groups of 24 h serum-starved cells were treated with Ang II plus AKF-PD, Losartan or DPI and DCF fluorescence was determined 60 min later. All AKF-PD, Losartan and DPI attenuated the generation of ROS (P < 0.01). There was no difference between AKF-PD and Losartan treatment (Fig. 3B,C). AKF-PDFluorofenidone/ inhibited expression of the Nox 2 subunit in rat NRK-52E cells [1] Cell pretreatment (24 h) with Ang II alone increased the protein expression of Nox1 and Nox2 (P < 0.01) (Fig. 4A). While, DPI blocked expression of Nox1 and Nox2 (P < 0.01), AKF-PD only blocked (P < 0.05) Nox2 expression. There was no difference between AKF-PD and Losartan. AKF-PD/Fluorofenidone inhibited Ang II-Induced phosphorylation of Akt in NRK-52E Cells [1] The time course of Akt activation in response to Ang II was examined. Increased level of p-Akt was detected as early as 15 min after Ang II treatment (Fig. 4C). While, used co-treatment with the PI3K inhibitor of LY29004 blocked the p-Akt (P < 0.01), AKF-PD and Losartan treatment dramatically decreased levels of p-Akt (P < 0.05), as shown in Figure 4(D). There was no difference among AKF-PD, Losartan and LY29004 (P > 0.05). AKF-PD/Fluorofenidone inhibited the PI3K/Akt signaling pathway in Ang II-treated NRK-52E cells [1] NRK-52E cells were transfected with a plasmid constitutively expressing the active form of PI3K (PI3K P110α-CAAX). Transiently transfected NRK-52E cells displayed an increased expression of p-Akt, p47phox, Nox2 and collagen I (α1) as well as increased production of ROS. The addition of AKF-PD reduced ROS formation (P < 0.01, Fig. 5) and expression of all proteins but Nox2. |
| ln Vivo |
AKF-PD/Fluorofenidone treatment attenuated renal interstitial injury and collagen deposition in vehicle-treated UUO rats [1]
Administration of both AKF-PD and Losartan significantly attenuated renal pathological alterations as evidenced by downregulating renal interstitial damage indexes (Fig. 1A). Moreover, AKF-PD and Losartan treatment also reduced (P < 0.05) the amount of tubulo-interstitial damage. While the interstitial accumulation of collagen fibres was increased in the kidneys in UUO rats, both AKF-PD and Losartan treatment attenuated (P < 0.05) collagen expression (Fig. 1B). Regarding the specific deposition of collagen types I and III, a small amount of both collagen types was observed surrounding vessels in the kidneys from sham-operated rats. Nonetheless, injured kidneys displayed considerably higher expression of collagen, which was significantly inhibited by both AKF-PD and Losartan treatment. AKF-PD/Fluorofenidone treatment attenuated Nox enzyme activity and expression of subunits in vehicle-treated UUO rats kidneys [1] Kidneys from UUO rats underwent oxidative stress as evidenced by significantly increased NADPH oxidase activity, as compared to sham rats (Fig. 2A). Treatment with AKF-PD and Losartan ameliorated the increased oxidase activity (P < 0.05) as compared to the UUO rats. The kidney from UUO rats displayed increased (P < 0.05) protein levels of four Nox subunits, namely Nox1, Nox2, p47phox and Nox4; conversely, the expression level of p22phox was unchanged (P > 0.05) between the UUO and sham groups (Fig. 2B,C). While AKF-PD and Losartan treatment attenuated Nox2, p47phox and Nox4 expression (P < 0.05), without affecting the expression of Nox1 or p22phox (P > 0.05). There was no statistical difference between AKF-PD and Losartan (P > 0.05) (Fig. 2B,C). AKF-PD/Fluorofenidone treatment attenuated lipid peroxidation in vehicle-treated UUO rats kidneys [1] The increase in oxidase activity in kidneys from UUO rats was also supported by evidence of lipid peroxidation given increased levels of 8-iso-PGF2a as compared to this in sham rats. Both AKF-PD and Losartan treatment attenuated the 8-iso-PGF2a expression (P < 0.05) (Fig. 2D). There was no statistical difference between the AKF-PD and Losartan treatment groups (P > 0.05) (Fig. 2D). AKF-PD/Fluorofenidone reduced Akt phosphorylation in fibrotic kidneys [1] Western blot analysis for Akt was consistent with UUO rats developing kidney injury as evidenced by a significant appearance of p-Akt as compared to sham rats. Treatment with AKF-PD or Losartan did counteract (P < 0.05) the increase in p-Akt expression as compared to untreated UUO rats (P < 0.05) (Fig. 2E,F). There was no statistical difference between AKF-PD and Losartan treatment (P < 0.05) (Fig. 2F). |
| Cell Assay |
Cell culture and treatment [1]
NRK-52E cells were purchased from ATCC. NRK-52E cells were cultured in DMEM supplemented with 5% FBS, streptomycin (100 μg/mL) and penicillin (100 units/mL) at 37°C in a 5% CO2 atmosphere in air. The cells were seeded on six-well culture plates to 60–70% confluence in the complete medium containing 10% FBS for 24 h, One day before treatment, cells were incubated with serum-free media for 24 h to synchronize the cell growth. Final Ang II concentration for 10−7 mol. to examine the effects of Fluorofenidone/AKF-PD and Losartan on Ang II induced expression of p-Akt, Nox1 and Nox2. The cells were treated with Fluorofenidone/AKF-PD (2 mM) or Losartan (10−5 mol) for 24 h, incubated with the PI3K inhibitor of LY294002 (25 μM, Cell Signaling) or NADPH oxidase inhibitor diphenyliodonium iodide (DPI) (10−7 mol) for 1 h, and were subsequently induced by Ang II (10−7 mol) for 15 min (p-Akt) and 24 h (Nox1, Nox2, fibronectin and Collagen I (1a) before cellular protein extraction. Each experiment was replicated three times. Transient transfection assays [1] Plasmids constitutively expressing the active form of PI3K (PI3K P110α-CAAX), respectively, were used. Transient transfection of cells with one or the other plasmid was conducted using Lipofectamine 2000 reagent following the protocol provided by the manufacturer. The production of ROS was then measured in these groups of cells (see below) following treatment with Fluorofenidone/AKF-PD and Losartan for 24 h. Each experiment was carried in triplicate. Measurement of ROS generation in intact cells [1] Changes in intracellular ROS levels were determined by measuring the oxidative conversion of cell-permeable DCFH-DA to DCF using a Microplate Reader. In brief, cells seeded onto a 96 well plate and treated as described above, washed with D-Hank's were solution and incubated with DCFH-DA (10 μM) at 37°C for 20 min in the dark. Cells were then washed in PBS, tripsinized and resuspended in 100 μL of PBS. Cellular ROS resulting from the oxidation of 2′,7′-dihydrofluorescein was measured (excitation: 488 nm; emission: 515 to 540 nm). Fluorescence data are expressed as percent increase over untreated samples. In addition, transfected NRK-52E cells were seeded onto a 50 mm dish and treated as described above. Following washes in PBS solution cells were incubated with DCFH-DA (10 mM) at 37°C for 20 min, in the dark. The oxidative conversion of cell-permeable DCFH-DA to fluorescent DCF was assessed by flow cytometry analysis using FACS calibur. The percentage of fluorescence intensity was assessed by ModFit LT software. Fluorescence data are expressed as percent increase over untreated samples. Each experiment was performed in triplicate. |
| Animal Protocol |
Animal and fluorofenidone treatment [1]
A total of 28 male Sprague–Dawley rats (220–250g body weight) were randomly assigned to four groups with seven animals in each, as follows: (i) UUO rats treated with 0.5% carboxymethyl cellulose sodium (CMC-Na) (designated as UUO); (ii) UUO rats treated with 500 mg/kg per day Fluorofenidone/AKF-PD (UUO + AKF-PD); (iii) UUO rats treated with 20 mg/kg per day Losartan (UUO + Losartan); and (iv) sham rats treated with 0.5% CMC-Na (sham). All rats were killed at day 14 after surgery, the left kidney was decapsulated. UUO operation method reference to Le Tulzo Y SR et al.17 |
| References |
|
| Additional Infomation |
Objective: Oxidative stress plays a crucial role in the progression of renal interstitial fibrosis. The nicotinamide adenine dinucleotide phosphate (NADPH) oxidase (Nox) family is considered a major source of reactive oxygen species (ROS). This study aimed to investigate the inhibitory effect of a novel antifibrotic drug, flufenidone (AKF-PD), on Nox-mediated oxidative stress and extracellular matrix (ECM) deposition in the development of renal interstitial fibrosis. Methods: Renal fibrosis was induced in a rat model of unilateral ureteral obstruction (UUO) using AKF-PD. The expression of Nox homologs, phosphorylated Akt (p-Akt), and type I and type III collagen was detected by Western blotting or immunohistochemistry. The level of 8-isoprostaglandin F2α (8-Iso PGF2α) was measured by enzyme-linked immunosorbent assay (ELISA). In addition, this study also examined the expression of reactive oxygen species (ROS) and type I collagen (1a), Nox subunit and phosphorylated Akt (p-Akt) in angiotensin II (Ang II) stimulated rat proximal tubular epithelial cell (NRK-52E) culture. The results showed that AKF-PD treatment significantly reduced renal tubular interstitial injury, extracellular matrix (ECM) deposition and oxidative stress in fibrotic rat kidneys. In addition, AKF-PD inhibited the expression of ROS, type I collagen (1a), Nox2 and p-Akt in Ang II stimulated NRK-52E cells. Conclusion: AKF-PD partially inhibits NADPH oxidase and ECM deposition through the PI3K/Akt signaling pathway, thereby slowing the progression of renal interstitial fibrosis, suggesting that AKF-PD may be a novel potential drug for the treatment of renal fibrosis. [1] Pirfenidone is a pyridone compound and a highly effective and novel antifibrotic drug. This article describes the design, synthesis, and activity evaluation of a novel antifibrotic drug—glycosyl-modified 1-(substituted aryl)-5-trifluoromethyl-2(1H)pyridone. The inhibitory activity of most target compounds was comparable to or better than that of flufenidone. Notably, compound 19a exhibited the highest cytosolic activity against NIH 3T3 cells (IC50 = 0.17 mM). [2] In summary, we report the design, synthesis, and biological evaluation of several glycosyl-modified 1-(substituted aryl)-5-trifluoromethyl-2(1H)pyridones. Our study suggests that glycosyl-modified pirfenidone analogs appear to enhance their inhibitory activity against NIH 3T3 cell proliferation. Of the compounds tested, compound 19a, synthesized from pirfenidone analog 19 and modified with glucose, exhibited the highest cytosolic activity (IC50 = 0.17 mM). [2]
|
| Molecular Formula |
C12H10FNO
|
|---|---|
| Molecular Weight |
203.2164
|
| Exact Mass |
203.075
|
| Elemental Analysis |
C, 70.93; H, 4.96; F, 9.35; N, 6.89; O, 7.87
|
| CAS # |
848353-85-5
|
| Related CAS # |
Fluorofenidone-d3
|
| PubChem CID |
11851183
|
| Appearance |
White to off-white solid powder
|
| LogP |
2.285
|
| Hydrogen Bond Donor Count |
0
|
| Hydrogen Bond Acceptor Count |
2
|
| Rotatable Bond Count |
1
|
| Heavy Atom Count |
15
|
| Complexity |
322
|
| Defined Atom Stereocenter Count |
0
|
| SMILES |
O=C1N(C2C=C(F)C=CC=2)C=C(C)C=C1
|
| InChi Key |
JDZYVVUJIQYGRX-UHFFFAOYSA-N
|
| InChi Code |
InChI=1S/C12H10FNO/c1-9-5-6-12(15)14(8-9)11-4-2-3-10(13)7-11/h2-8H,1H3
|
| Chemical Name |
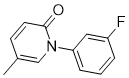
1-(3-fluorophenyl)-5-methylpyridin-2-one
|
| Synonyms |
AKF-PDAKFPD; AKF PD; FLUOROFENIDONE; 848353-85-5; 2(1H)-Pyridinone, 1-(3-fluorophenyl)-5-methyl-; 1-(3-Fluorophenyl)-5-methylpyridin-2(1H)-one; 1-(3-fluorophenyl)-5-methylpyridin-2-one; AKF-PD; Fluorofenidone?; 1-(3-fluorophenyl)-5-methyl-pyridin-2-one; AMR69 analog; Fluorofenidone
|
| HS Tariff Code |
2934.99.9001
|
| Storage |
Powder -20°C 3 years 4°C 2 years In solvent -80°C 6 months -20°C 1 month |
| Shipping Condition |
Room temperature (This product is stable at ambient temperature for a few days during ordinary shipping and time spent in Customs)
|
| Solubility (In Vitro) |
DMSO: ~140 mg/mL (~688.9 mM)
|
|---|---|
| Solubility (In Vivo) |
Solubility in Formulation 1: ≥ 2.33 mg/mL (11.47 mM) (saturation unknown) in 10% DMSO + 40% PEG300 + 5% Tween80 + 45% Saline (add these co-solvents sequentially from left to right, and one by one), clear solution.
For example, if 1 mL of working solution is to be prepared, you can add 100 μL of 23.3 mg/mL clear DMSO stock solution to 400 μL PEG300 and mix evenly; then add 50 μL Tween-80 to the above solution and mix evenly; then add 450 μL normal saline to adjust the volume to 1 mL. Preparation of saline: Dissolve 0.9 g of sodium chloride in 100 mL ddH₂ O to obtain a clear solution. Solubility in Formulation 2: ≥ 2.33 mg/mL (11.47 mM) (saturation unknown) in 10% DMSO + 90% (20% SBE-β-CD in Saline) (add these co-solvents sequentially from left to right, and one by one), clear solution. For example, if 1 mL of working solution is to be prepared, you can add 100 μL of 23.3 mg/mL clear DMSO stock solution to 900 μL of 20% SBE-β-CD physiological saline solution and mix evenly. Preparation of 20% SBE-β-CD in Saline (4°C,1 week): Dissolve 2 g SBE-β-CD in 10 mL saline to obtain a clear solution. View More
Solubility in Formulation 3: ≥ 2.33 mg/mL (11.47 mM) (saturation unknown) in 10% DMSO + 90% Corn Oil (add these co-solvents sequentially from left to right, and one by one), clear solution. |
| Preparing Stock Solutions | 1 mg | 5 mg | 10 mg | |
| 1 mM | 4.9208 mL | 24.6039 mL | 49.2078 mL | |
| 5 mM | 0.9842 mL | 4.9208 mL | 9.8416 mL | |
| 10 mM | 0.4921 mL | 2.4604 mL | 4.9208 mL |
*Note: Please select an appropriate solvent for the preparation of stock solution based on your experiment needs. For most products, DMSO can be used for preparing stock solutions (e.g. 5 mM, 10 mM, or 20 mM concentration); some products with high aqueous solubility may be dissolved in water directly. Solubility information is available at the above Solubility Data section. Once the stock solution is prepared, aliquot it to routine usage volumes and store at -20°C or -80°C. Avoid repeated freeze and thaw cycles.
Calculation results
Working concentration: mg/mL;
Method for preparing DMSO stock solution: mg drug pre-dissolved in μL DMSO (stock solution concentration mg/mL). Please contact us first if the concentration exceeds the DMSO solubility of the batch of drug.
Method for preparing in vivo formulation::Take μL DMSO stock solution, next add μL PEG300, mix and clarify, next addμL Tween 80, mix and clarify, next add μL ddH2O,mix and clarify.
(1) Please be sure that the solution is clear before the addition of next solvent. Dissolution methods like vortex, ultrasound or warming and heat may be used to aid dissolving.
(2) Be sure to add the solvent(s) in order.
|
Products are for research use only; We do not sell to patients
Copyright 2020 InvivoChem LLC | All Rights Reserved


 COA
COA
