| Size | Price | Stock | Qty |
|---|---|---|---|
| 1mg |
|
||
| 2mg |
|
||
| 5mg |
|
||
| 10mg |
|
||
| 25mg |
|
||
| 50mg |
|
||
| 100mg |
|
||
| Other Sizes |
Purity: ≥98%
| Targets |
PD-1/PD-L1 interaction (IC50 = 1.4 nM)
Programmed Death-Ligand 1 (PD-L1, CD274) (Ki = 0.7 nM in SPR binding assay; IC₅₀ = 1.2 nM in PD-1/PD-L1 interaction inhibition assay) [3] Programmed Death-1 (PD-1, CD279) (Ki > 1000 nM, no significant binding) [3] Other immune checkpoints (selectivity > 800-fold vs. PD-L1): CTLA-4 (Ki > 1000 nM), B7-H3 (Ki > 1000 nM), VISTA (Ki > 1000 nM) [3] |
|---|---|
| ln Vitro |
BMS-1166 exhibits low toxicity toward the tested cell lines and inhibits the interaction of soluble PD-L1 with PD-1 expressed on the cell surface. The T-cell receptor-mediated activation of T lymphocytes is inhibited by soluble PD-L1, but BMS-1166 reduces this effect[2].
BMS-1001 and BMS-1166 antagonize the inhibitory effect of PD-1/PD-L1 immune checkpoint on T cell activation. BMS-1001 and BMS-1166 antagonize the inhibitory effect of soluble PD-L1 on T cells. BMS-1001 and BMS-1166 induce PD-L1 dimerization in solution. BMS-1001 and BMS-1166, present significantly improved cytotoxic properties, allowing the use of higher concentrations. In addition, unlike the three compounds described earlier, BMS-1001 and −1166 present the potential of restoring the activation of effector Jurkat T cells, attenuated by both soluble and membrane-bound PD-L1 presented by antigen-presenting cells.[2] 1. Potent inhibition of PD-1/PD-L1 interaction: BMS-1166, a small-molecule PD-L1 inhibitor, specifically blocked the interaction between human PD-1 and PD-L1 with an IC₅₀ of 1.2 nM (HTRF assay) and bound to PD-L1 with high affinity (Ki = 0.7 nM, SPR assay). It showed no significant binding to PD-1 (Ki > 1000 nM) or other immune checkpoints (CTLA-4, B7-H3, VISTA), confirming PD-L1-specific targeting [3] 2. Activation of T cell-mediated anti-tumor immunity: In co-culture experiments of human peripheral blood mononuclear cells (PBMCs) and PD-L1-positive A375 melanoma cells, BMS-1166 (0.01-1 μM) dose-dependently enhanced T cell activation. At 0.1 μM, it increased IFN-γ secretion by 3.8-fold, TNF-α by 2.9-fold, and granzyme B by 3.2-fold (ELISA). It also promoted T cell proliferation (CFSE staining: proliferation index increased from 1.8 to 4.5 at 1 μM) and reduced PD-L1 expression on A375 cells by 45% (flow cytometry) [3] 3. Antiproliferative activity against PD-L1-positive tumor cells: BMS-1166 (0.001-10 μM) inhibited proliferation of PD-L1-high tumor cell lines (A375, IC₅₀ = 0.08 μM; HCT116, IC₅₀ = 0.12 μM; MCF-7, IC₅₀ = 0.15 μM) in a T cell-dependent manner. It had no significant effect on PD-L1-negative tumor cells (MDA-MB-231, IC₅₀ > 10 μM) or normal human fibroblasts (NHF, CC₅₀ > 50 μM), indicating immune-mediated anti-tumor activity [3] 4. Modulation of PD-L1 signaling pathway: BMS-1166 (0.01-1 μM) downregulated PD-L1 protein levels in A375 cells (Western blot: 60% reduction at 1 μM) without affecting PD-L1 mRNA expression (qPCR), suggesting post-transcriptional regulation. It also inhibited STAT3 phosphorylation (Ser727) by 55% at 1 μM, a key pathway mediating PD-L1 upregulation in tumor cells [3] |
| ln Vivo |
In Vivo Antitumor Activity of NP19 [[an analog of BMS-1166]] in an H22 Hepatoma Mouse Model[3]
Encouraged by the excellent in vivo antitumor efficacy of NP19 on the melanoma B16-F10 tumor model, and the fact that PD-1/PD-L1 inhibitors have broad spectrum of antitumor activities, we further evaluated the in vivo antitumor efficacy of compound NP19 using an H22 hepatoma tumor model in BALB/c mice. Each mouse was injected with 0.8 million H22 cells subcutaneously into the right flank. After tumors reached approximately 100 mm3 in volume, mice were randomized and treated by intraperitoneal (i.p.) injection of NP19 or a vehicle solution for 14 days. As shown in Figure 8, NP19 demonstrated significant in vivo antitumor efficacy with a TGI of 76.5% at the dose of 25 mg/kg (Figure 8A, 8B, 8C). In addition, NP19 did not cause an obvious body weight loss (Figure 8D), indicating that the compound was well tolerated. In Vivo Antitumor Activity of NP19 [[an analog of BMS-1166]] in a B16-F10 Mouse Melanoma Model[3] To determine whether the in vitro anti-PD-1/PD-L1 activity of the newly synthesized compounds can be translated into in vivo efficacy, we tested the antitumor activity of compound NP19 on a mice melanoma B16–F10 tumor model. NP19 was chosen for the in vivo efficacy study due to the ease of synthesis and less cytotoxicity (Table 9) when compared to the more potent compound NP2 or equally potent compound NP12. We treated BALB/c mice bearing melanoma tumors with vehicle control and NP19 (25 mg/kg, 50 mg/kg, 100 mg/kg) administered via intragastric gavage once a day for 15 days. As shown in Figure 6, after 15 days of treatment, the growth of melanoma tumors was inhibited dramatically following NP19 treatment. In Vivo Pharmacokinetic Properties of NP19 [[an analog of BMS-1166]][3] As compound NP19 showed high potency in vitro, the pharmacokinetic (PK) profiles were next evaluated in male Sprague–Dawley rats by intravenous and oral administration. The key p.o. and i.v. administration PK parameters are summarized in Table 8. After a single i.v. administration with 1 mg/kg compound NP19, the half time (t1/2), the clearance rate (CL), and the apparent distribution volume (Vss) of NP19 are 1.5 ± 0.5 h, 0.9 ± 0.2 L/h/kg, and 2.1 ± 0.5 L/kg, respectively. When NP19 was administrated by the oral route at 10 mg/kg, the oral absorption (Tmax = 0.6 ± 0.2 h), long half-life (t1/2 = 10.9 ± 7.7 h), and oral bioavailability (F = 5%) were observed. In addition, no apparent adverse effects were observed in rats. NP19 showed a much longer half-life (10.9 h) following oral gavage as compared to the i.v. half-life (1.5 h); this may be due to the high lipophilicity (logP = 7.9) or poor aqueous solubility of NP19. As a result, NP19 exhibited flip-flop pharmacokinetics. Such flip-flop pharmacokinetics can sometimes occur for poorly water-soluble compounds such as Rebamipide, which has a t1/2 (p.o.)/t1/2 (i.v.) ratio of 13.5 due to poor water solubility (7.6 μg/mL). Another example is the lipophilic compound IAT (an antitubulin agent with 19 μg/mL of water solubility) reported by Chien-ming Li et al., which has a t1/2 (p.o.)/t1/2 (i.v.) ratio of ∼5, similar to NP19 [t1/2 (p.o.)/t1/2 (i.v.) = 7.1]. Due to the low oral bioavailability of the compound NP19, we presumed that a high dosage is needed to offer sufficient drug concentration to exhibit antitumor efficacy. Therefore, we further studied the in vivo activity of compound NP19. 1. Antitumor efficacy in PD-L1-positive tumor xenograft models: BALB/c nu/nu mice reconstituted with human PBMCs were subcutaneously inoculated with 5×10⁶ A375 cells. When tumors reached 100-150 mm³, mice were treated with BMS-1166 (10, 30 mg/kg, oral gavage, once daily) for 21 days. The 30 mg/kg group showed 75% tumor volume reduction (P < 0.001) and 68% tumor weight reduction (P < 0.001) compared to vehicle. Tumor tissue analysis revealed increased CD8⁺ T cell infiltration (3.2-fold), IFN-γ-positive cells (2.8-fold), and reduced PD-L1 expression (50%) [3] 2. Enhancement of anti-tumor immunity in syngeneic mouse model: C57BL/6 mice were subcutaneously inoculated with 2×10⁶ MC38 colon cancer cells (PD-L1-positive). BMS-1166 (30 mg/kg, oral, once daily) for 14 days reduced tumor volume by 65% (P < 0.001) and prolonged median survival from 28 days to 45 days (P < 0.01). Flow cytometry of tumor-infiltrating lymphocytes (TILs) showed increased CD8⁺/CD4⁺ T cell ratio (from 0.8 to 1.9) and reduced regulatory T cells (Tregs, CD4⁺CD25⁺Foxp3⁺) by 40% [3] |
| Enzyme Assay |
In Vitro PD-1/PD-L1 Binding Assay[3]
\The ability of compounds in inhibition of PD-1/PD-L1 interaction was investigated using a PD-1/PD-L1 homogenous time-resolved fluorescence (HTRF) binding assay. The PD-1/PD-L1 binding assay kits were purchased from Cisbio. The experiments were performed according to the instruction manual which could be downloaded at https://www.cisbio.com/usa/drug-discovery/human-pd1pd-l1-biochemical-interaction-assay.\ \BMS disclosed recently the first nonpeptidic small molecule inhibitors against the PD-1/PD-L1 pathway that showed the activity in a homogeneous time-resolved fluorescence (HTRF) binding assay; however no further data supporting their activity were provided. NMR measurements[2] \Uniform 15N labelling was obtained by expressing proteins in the M9 minimal medium containing 15NH4Cl as the sole nitrogen source. For NMR measurements the buffer was exchanged by gel filtration to PBS pH 7.4 (PD-L1) or 25 mM sodium phosphate containing 100 mM NaCl pH 6.4 (PD-1). 10% (v/v) of D2O was added to the samples to provide the lock signal. All spectra were recorded at 300K using a Bruker Avance III 600 MHz spectrometer. The interaction of the compounds with PD-L1 was evaluated by monitoring the perturbations in chemical shifts of NMR resonances in the 1H-15N 2D HMQC upon titration with the compound. The ability of tested compounds to dissociate PD-L1/PD-1 was evaluated using the Antagonist Induced Dissociation Assay. In brief, 15N-labeled PD-1 (0.2 mM) was slightly overtitrated with the unlabeled PD-L1. The compounds were aliquoted into the resulting mixture. During the experiment the 1H-15N signals were monitored by the HMQC. PD1/PD-L1 checkpoint assay[2] \The aAPCs were seeded in white 96-well plates at the density of 10 000 per well in the culture medium 24 h prior to the assay. On the day of the assay, 3.5x serial dilutions of the antibodies were prepared in the RPMI 1640-containing 1% FBS. Serial dilutions of BMS compounds [BMS-1166] were prepared in DMSO and formulated in RPMI 1640-containing 1% FBS. By this, the concentration of DMSO was kept constant in all samples. 95 μl of the medium was removed from the wells and the cells were overlaid with 40 μl of the compound dilutions. 20 000 of ECs were added to each well in 40 μl RPMI 1640 containing 1% FBS. Following 6 h incubation at 37°C, the plates were equilibrated at room temperature for 10 min and 80 μl of the Bio-Glo reagent was added to each well. After incubation for 10 min, luminescence was quantified using FlexStation 3. Half maximal effective concentrations (EC50) and maximal luminescence values (RLUmax) were determined by fitting the Hill equation to the experimental data.\ \PD-1/sPD-L1 effector assay[2] \For the evaluation of the BMS impact on T cell inhibition by soluble PD-L1, the ECs were stimulated with the anti-CD3 antibody in the presence of the recombinant human sPD-L1. For this, the 96-well white flat bottom plates were coated overnight at 4°C with 5 μg/ml of the anti-CD3 antibody or the isotype control solution in PBS. The antibody solution was removed and the plates were washed 3 times with PBS and dried. sPD-L1 (aa 18–134) was diluted in PBS supplemented with the penicillin/streptomycin solution (100 U/ml final concentration each) in the presence of the BMS compounds [BMS-1166] or a corresponding volume of DMSO. Then, 15 μl of the solution was added to each well of the antibody-coated plate. ECs were centrifuged and diluted to 50 000 per ml, and 60 μl of the cell solution was added to each well. The final concentration of sPD-L1 was 10 μg/ml (0.6 μM). The final concentrations of the BMS compounds [BMS-1166] were: 0.12, 0.3, 1.2 and 3 μM, giving the following BMS:sPD-L1 molar ratios: 1:5, 1:2, 2:1 and 5:1. The cells were cultured for 24 h and the luciferase activity assay was performed using the Bio-Glo Luciferase Assay System according to the manufacturer's instructions.\ 1. SPR-based PD-L1 binding assay: Immobilize recombinant human PD-L1 (extracellular domain) on a CM5 sensor chip. Inject serial dilutions of BMS-1166 (0.001-10 nM) in running buffer (PBS, pH 7.4, 0.05% Tween-20) at a flow rate of 30 μL/min. Record sensorgrams to measure binding affinity (Ka, Kd) and calculate Ki values using steady-state affinity model. For selectivity assessment, repeat the assay with recombinant PD-1, CTLA-4, B7-H3, and VISTA proteins [3] 2. HTRF PD-1/PD-L1 interaction inhibition assay: Prepare recombinant human PD-1 (labeled with Eu³⁺-cryptate) and PD-L1 (labeled with XL665). Set up reaction mixtures containing 20 nM PD-1, 15 nM PD-L1, and serial dilutions of BMS-1166 (0.001-10 nM) in assay buffer (50 mM Tris-HCl, pH 7.5, 150 mM NaCl, 0.01% BSA). Incubate at room temperature for 1 hour, measure HTRF signal (excitation: 337 nm, emission: 620 nm and 665 nm). Calculate inhibition percentage and IC₅₀ values by nonlinear regression [3] |
| Cell Assay |
Cell lines[2]
To verify the potency of BMS compounds [BMS-1166] in the inhibition of the PD-1/PD-L1 interactions, a cell-based model of the PD-1/PD-L1 immune checkpoint blockade was used. In the assay, two model cell lines are utilized: the artificial Antigen-Presenting Cells (PD-L1+ aAPC/CHO-K1 cells, called aAPCs) overexpressing TCR ligand and PD-L1, and T cell surrogate, a modified Jurkat T cell line overexpressing PD-1 and carrying a luciferase reporter under the control of NFAT promoter (PD-1 Effector Cells, called ECs). The cells were obtained from Promega and cultured in the RPMI 1640 medium supplemented with 10% Fetal Bovine Serum, 100 U/ml Penicillin and 100 U/ml Streptomycin. Additionally, the cells were propagated in a constant presence of Hygromycin B (50 μg/ml) and G418 (250 μg/ml) to provide a stable expression of the introduced genetic constructs. The two latter antibiotics were omitted in the experiments. Overexpression of PD-1 on ECs and PD-L1 on aAPCs was verified by flow cytometry (not shown) and the presence of the luciferase-expressing gene was verified by monitoring luciferase activity following anti-CD3 antibody stimulation. Antibiotic selection, flow cytometry and reporter expression served as cell line authentication method. The cells were periodically tested and found negative for Mycoplasma contamination using PCR-based method. Cytotoxicity assay[2] 5 000 ECs were seeded on transparent 96-well plates and cultured for 48 h in the presence of increasing concentrations of the BMS compounds [BMS-1166] or DMSO as a control (the concentration of DMSO was kept constant in all samples). Following the treatment, a metabolic activity test was performed with the use of Biolog Redox Dye Mix MB, according to the manufacturer's instructions. Flow cytometry measurements[2] Binding of sPD-L1 (aa 18–134) to ECs was evaluated by flow cytometry. The His-tagged PD-L1 protein or its mutants were stained with NTA-Atto 647 N fluorescent dye for 2 h at 22°C, at 8:1 molar ratio (protein:dye). PD-L1-Atto was formulated in 150 μl PBS with the tested compounds or antibodies. The samples were incubated for 30 min at 4°C in the dark. Meanwhile, ECs were centrifuged, washed with PBS and suspended in fresh PBS at concentration of 1 × 10⁶ cells per ml. 50 μl of ECs was added to each sample and incubated on ice for additional 60 min. The final concentrations of the components were: 25 μg/ml of PD-L1 (1.5 μM), 125 μg/ml the anti-PD-L1 antibodies and control antibodies and 1 μM of the BMS compounds [BMS-1166] . The samples were analyzed using the BD FACS Verse flow cytometer and BD FACSuite v1.0.6 software. 1. T cell activation co-culture assay: Seed A375 cells (5×10⁴ cells/well) in 24-well plates, incubate overnight. Add human PBMCs (1×10⁶ cells/well) and BMS-1166 (0.01-1 μM) (vehicle: DMSO + RPMI 1640 medium). Incubate at 37°C, 5% CO₂ for 72 hours. Collect supernatants to measure IFN-γ, TNF-α, and granzyme B levels by ELISA. Stain PBMCs with CFSE to assess T cell proliferation by flow cytometry [3] 2. Tumor cell proliferation assay (CCK-8): Seed PD-L1-positive (A375, HCT116, MCF-7) and PD-L1-negative (MDA-MB-231) tumor cells, and NHF (5×10³ cells/well) in 96-well plates. Incubate overnight, add BMS-1166 (0.001-10 μM) and PBMCs (1×10⁴ cells/well, as effector cells). Incubate for 72 hours, add CCK-8 solution, measure absorbance at 450 nm. Calculate cell viability and IC₅₀/CC₅₀ values [3] 3. PD-L1 expression and signaling assay: Seed A375 cells (1×10⁶ cells/well) in 6-well plates, incubate overnight. Treat with BMS-1166 (0.01-1 μM) for 24 hours. For PD-L1 expression: Stain cells with anti-PD-L1 antibody and analyze by flow cytometry. For Western blot: Lyse cells, detect PD-L1, p-STAT3 (Ser727), total STAT3, and GAPDH (loading control). For qPCR: Extract total RNA, quantify PD-L1 mRNA (GAPDH as internal control) [3] |
| Animal Protocol |
Pharmacokinetic Study in Male Sprague–Dawley Rats[3]
Male Sprague–Dawley rats (200–220 g) were used to study the pharmacokinetics of compound NP19 [an analog of BMS-1166]. Diet was prohibited for 12 h before the experiment, but water was freely available. Blood samples (0.3 mL) were collected from the tail vein into heparinized 1.5 mL polythene tubes at 0.0833, 0.25, 0.5, 1, 1.5, 2, 4, 6, 8, 12, and 24 h after oral (10 mg/kg) or intravenous (1 mg/kg) administration of compound NP19. The compound was dissolved in 5% DMSO and 95% PEG-300 for intravenous administration or suspended in 0.5% sodium carboxymethyl cellulose (CMC-Na) for oral administration. The samples were immediately centrifuged at 3000g for 10 min. The plasma as-obtained (100 μL) was stored at −20 °C until analysis. PK parameters were determined from individual animal data using noncompartmental analysis in DAS (Drug and statistics) software. Instruments and analytical conditions for PK studies: A UPLC-MS/MS system with ACQUITY I-Class UPLC and a XEVO TQD triple quadrupole mass spectrometer (Waters Corp., Milford, MA, USA), equipped with an electrospray ionization (ESI) interface, was used to analyze the blood samples. The UPLC system was comprised of a Binary Solvent Manager (BSM) and a Sample Manager with Flow-Through Needle (SM-FTN). Masslynx 4.1 software (Waters Corp.) was used for data acquisition and instrument control. Multiple reaction monitoring (MRM) modes of m/z 555.35 → 181.03 for NP19 and m/z 237 → 194.1 for carbamazepine were utilized to conduct quantitative analysis. In Vivo Efficacy Study in Mouse B16F10 Melanoma Model[3] BALB/c mice, aged 6–8 weeks old, were used to study the inhibition effect of NP19 [an analog of BMS-1166]on subcutaneous transplanted model of melanoma cells. Murine B16F10 melanoma cells growing in a logarithmic growth phase were suspended in PBS at a density of 2 × 10⁶ per mL. Each mouse was inoculated subcutaneously with 200 μL containing 4 × 10⁵ cells. After tumors reached approximately 100 mm3 in volume, mice were divided into four groups randomly (n = 10) and treated with NP19 (25, 50, 100 mg/kg) and vehicle, respectively. The drugs were administered via intragastric gavage once a day for 15 days. The vehicle group was administered with 0.5% sodium carboxymethyl cellulose (CMC-Na). Animal activity and body weight were monitored during the entire experiment period to assess acute toxicity. Mice were sacrificed 16 days after the initiation of the treatment, and the tumor tissue and major organ (liver, spleen, thymus, and kidney) samples were collected. The harvested tumor tissue and organs (liver, kidney) were fixed in 4% paraformaldehyde, processed into paraffin routinely, stained with hematoxylin and eosin (H&E), and captured by microscope. Tumor growth inhibition value (TGI) was calculated using the formula: TGI(%) = [1 – Wt/Wv] × 100%, where Wt and Wv are the mean tumor weight of treatment group and vehicle control. In Vivo Efficacy Study in Mouse H22 Hepatoma Tumor Model[3] 6–8 weeks old male BALB/c mice were used. A total of 8 × 10⁵ H22 cells were inoculated into the right flank of each mouse according to protocols of tumor transplant research. NP19 [an analog of BMS-1166]was dissolved in 5% DMSO, 40% PEG-200 and 55% saline solution to produce desired concentrations. Mice in control groups were injected intraperitoneally with 200 μL of vehicle solution only. Tumor volume was measured every 2 days with a traceable electronic digital caliper and calculated using the formula a × b2 × 0.5, where a and b represented the larger and smaller diameters, respectively. The mice were sacrificed after the treatments and tumors were excised and weighed. 1. Human PBMC-reconstituted A375 xenograft model: Female BALB/c nu/nu mice (6-8 weeks old, n=6 per group) were intraperitoneally injected with 5×10⁷ human PBMCs. Seven days later, 5×10⁶ A375 cells (suspended in PBS:Matrigel=1:1) were subcutaneously inoculated into the right flank. When tumors reached 100-150 mm³, BMS-1166 was dissolved in DMSO (10%) + PEG400 (40%) + saline (50%) and administered via oral gavage (10 or 30 mg/kg) once daily for 21 days. Vehicle group received the same solvent mixture. Tumor volume (length × width² / 2) and body weight were measured every 3 days. At study end, tumors were dissected for flow cytometry (TILs) and immunohistochemistry (PD-L1, CD8⁺ T cells) [3] 2. MC38 syngeneic tumor model: Male C57BL/6 mice (6-8 weeks old, n=8 per group) were subcutaneously inoculated with 2×10⁶ MC38 cells. When tumors reached 80-100 mm³, BMS-1166 (30 mg/kg, oral gavage, once daily) or vehicle (0.5% methylcellulose) was administered for 14 days. Tumor volume and body weight were monitored every 2 days. Survival was recorded for 60 days. Tumors were collected for TIL analysis by flow cytometry [3] |
| ADME/Pharmacokinetics |
1. Oral absorption: BMS-1166 showed good oral bioavailability in mice (68% at a single oral dose of 30 mg/kg) and rats (59% at a single oral dose of 20 mg/kg). Peak plasma concentration (Cₘₐₓ) was 4.2 μg/mL in mice (Tₘₐₓ = 1.5 hours) and 3.8 μg/mL in rats (Tₘₐₓ = 2 hours) [3] 2. Plasma protein binding rate: The in vitro human plasma protein binding rate was 92-94% (concentration range: 0.1-10 μg/mL), with no concentration-dependent binding [3] 3. Half-life: The terminal elimination half-life (t₁/₂) was 6.8 hours in mice, 8.5 hours in rats, and 10.2 hours in dogs [3] 4. Tissue distribution: After a single oral administration of 30 mg/kg to mice, the highest tissue concentrations were found in the liver, spleen, and tumor tissue (tumor/plasma ratio was 2.8 at 4 hours), with moderate permeability in the lungs. Kidney (tissue/plasma ratio = 1.5-1.8) [3]
5. Metabolism and excretion: BMS-1166 is mainly metabolized in the liver via CYP3A4-mediated oxidative metabolism. The major metabolites (M1, M2) are inactive against PD-L1 (IC₅₀ > 10 μM). In rats, 65% of the intravenously administered dose was excreted in feces within 72 hours (28% of the original drug) and 25% was excreted in urine (8% of the original drug) [3] |
| Toxicity/Toxicokinetics |
1. In vitro cytotoxicity: BMS-1166 showed low cytotoxicity to normal human cells (NHF, CC₅₀ > 50 μM; PBMC, CC₅₀ > 50 μM) and no significant hemolytic activity was observed at concentrations up to 10 μM [3] 2. In vivo safety: In 21-day xenograft and 14-day syngeneic mouse studies, BMS-1166 (10-30 mg/kg, orally) did not cause significant changes in body weight (average weight loss <3%), food intake, or mortality. Serum ALT, AST, BUN, and creatinine levels were within the normal range. Histopathological examination of the liver, kidneys, heart, and lungs revealed no drug-related lesions [3] 3. Immune-related toxicity: No significant immune-related adverse events (e.g., colitis, hepatitis) were observed. Peripheral blood flow cytometry analysis showed no abnormal changes in the CD4⁺/CD8⁺ T cell ratio or inflammatory cytokine levels [3]
|
| References | |
| Additional Infomation |
Cancer immunotherapy based on antibodies targeting the PD-1/PD-L1 immune checkpoint pathway has achieved unprecedented clinical efficacy and constitutes a new paradigm for cancer treatment. However, antibody-based immunotherapy also has some limitations, such as high antibody production costs or long half-lives. Small molecule inhibitors of PD-1/PD-L1 interaction are highly anticipated and are regarded as a promising alternative or complementary therapy to monoclonal antibodies (mAbs). Currently, the research and development of anti-PD-1/PD-L1 small molecule inhibitors is in a booming stage. This article reviews anti-PD-1/PD-L1 small molecule and peptide inhibitors and discusses their latest structural and preclinical/clinical progress. The development of therapies based on small molecule inhibitors of PD-1/PD-L1 interaction has brought a promising but also very challenging direction to cancer treatment. [1] In recent years, antibodies targeting the PD-1/PD-L1 immune checkpoint have achieved significant success in anti-cancer treatment. In contrast, there are currently no reports on small molecule compounds with cellular activity. The evidence presented in this article suggests that small molecule compounds can alleviate PD-1/PD-L1 immune checkpoint-mediated Jurkat T lymphocyte exhaustion. Two optimized small molecule PD-1/PD-L1 interaction inhibitors, BMS-1001 and BMS-1166, developed by Bristol-Myers Squibb, bind to human PD-L1 and block its interaction with PD-1 when tested on isolated proteins. These compounds exhibit low toxicity to the tested cell lines and block the interaction between soluble PD-L1 and PD-1 expressed on the cell surface. Therefore, BMS-1001 and BMS-1166 alleviate the inhibitory effect of soluble PD-L1 on T cell receptor-mediated T lymphocyte activation. Furthermore, these compounds effectively attenuate the inhibitory effect of cell surface PD-L1. We also resolved the X-ray crystal structures of the BMS-1001 and BMS-1166 complexes with PD-L1, revealing a possible reason for the enhanced potency of these compounds compared to their precursors. Further research is expected to develop anticancer therapies based on oral immune checkpoint inhibitors. [2]
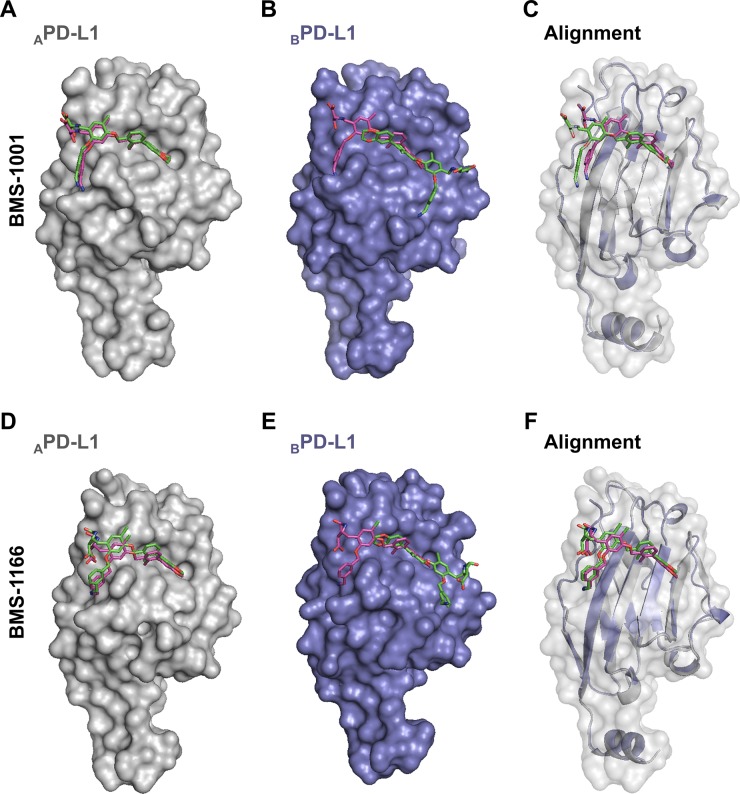
Blocking the PD-1/PD-L1 immune checkpoint pathway with monoclonal antibodies has significantly advanced the development of cancer treatment. However, antibody-based immunotherapy also has some drawbacks, such as high cost, limited half-life, and immunogenicity. Due to the incomplete structural information of this pathway, the development of small molecule PD-1/PD-L1 inhibitors that can overcome these drawbacks has been slow. Bristol-Myers Squibb recently announced the first batch of chemically synthesized PD-1/PD-L1 inhibitors. This article will introduce the NMR and X-ray crystal structure characterization of these two types of inhibitors. The X-ray crystal structure of the PD-L1/inhibitor complex shows that an inhibitor molecule is located at the center of the PD-L1 homodimer, filling a deep hydrophobic channel-like pocket between the two PD-L1 molecules. The structure of (2-methyl-3-biphenyl)methanol derivatives is blocked on one side of the channel, while compounds based on [3-(2,3-dihydro-1,4-benzodioxin-6-yl)-2-methylphenyl]methanol induce a larger interaction interface, thereby forming an open “face-back” tunnel in the PD-L1 dimer. [3] 1. Chemical and structural properties: BMS-1166 is a synthetic small molecule PD-L1 inhibitor with the chemical name N-(3-((4-(4-fluorophenyl)-6-methyl-2-oxo-1,2,3,4-tetrahydropyrimidin-5-yl)methoxy)phenyl)acrylamide. It is a white crystalline powder, soluble in DMSO (≥50 mg/mL) and ethanol (≥15 mg/mL), and slightly soluble in water [3] 2. Mechanism of action: BMS-1166 has a high affinity for the PD-1 binding domain of PD-L1 and can block PD-1/PD-L1 interaction. This can reverse PD-L1-mediated T cell exhaustion, activate T cell proliferation and cytokine secretion, and enhance T cell-mediated killing of PD-L1-positive tumor cells. It can also downregulate PD-L1 expression on tumor cells by inhibiting STAT3 phosphorylation, further enhancing anti-tumor immunity [3] 3. Therapeutic potential: It has been developed for the treatment of PD-L1-positive solid tumors, including melanoma, colon cancer, breast cancer and non-small cell lung cancer. Its oral bioavailability is high, its PD-L1 selectivity is strong, and its safety is good, which supports its use as a monotherapy or in combination with chemotherapy, targeted therapy or other immune checkpoint inhibitors [3] 4. Superior to antibody-based PD-L1 inhibitors: Compared with anti-PD-L1 antibodies (such as atezolizumab), BMS-1166 has the advantages of convenient oral administration, better tissue penetration (especially for solid tumors), and lower production cost. It can also regulate PD-L1 expression on tumor cells, thereby exerting a dual mechanism of action (blocking interaction + downregulating expression) [3] |
| Molecular Formula |
C36H33CLN2O7
|
|
|---|---|---|
| Molecular Weight |
641.11
|
|
| Exact Mass |
640.2
|
|
| Elemental Analysis |
C, 67.44; H, 5.19; Cl, 5.53; N, 4.37; O, 17.47
|
|
| CAS # |
1818314-88-3
|
|
| Related CAS # |
BMS-1166 hydrochloride;2113650-05-6
|
|
| PubChem CID |
118434635
|
|
| Appearance |
White to off-white solid powder
|
|
| LogP |
3.6
|
|
| Hydrogen Bond Donor Count |
2
|
|
| Hydrogen Bond Acceptor Count |
9
|
|
| Rotatable Bond Count |
10
|
|
| Heavy Atom Count |
46
|
|
| Complexity |
1060
|
|
| Defined Atom Stereocenter Count |
2
|
|
| SMILES |
CC1=C(C=CC=C1C2=CC3=C(C=C2)OCCO3)COC4=C(C=C(C(=C4)OCC5=CC(=CC=C5)C#N)CN6C[C@@H](C[C@@H]6C(=O)O)O)Cl
|
|
| InChi Key |
QBXVXKRWOVBUDB-GRKNLSHJSA-N
|
|
| InChi Code |
InChI=1S/C36H33ClN2O7/c1-22-26(6-3-7-29(22)25-8-9-32-35(14-25)44-11-10-43-32)21-46-34-16-33(45-20-24-5-2-4-23(12-24)17-38)27(13-30(34)37)18-39-19-28(40)15-31(39)36(41)42/h2-9,12-14,16,28,31,40H,10-11,15,18-21H2,1H3,(H,41,42)/t28-,31-/m1/s1
|
|
| Chemical Name |
(2R,4R)-1-[[5-chloro-2-[(3-cyanophenyl)methoxy]-4-[[3-(2,3-dihydro-1,4-benzodioxin-6-yl)-2-methylphenyl]methoxy]phenyl]methyl]-4-hydroxypyrrolidine-2-carboxylic acid
|
|
| Synonyms |
|
|
| HS Tariff Code |
2934.99.9001
|
|
| Storage |
Powder -20°C 3 years 4°C 2 years In solvent -80°C 6 months -20°C 1 month |
|
| Shipping Condition |
Room temperature (This product is stable at ambient temperature for a few days during ordinary shipping and time spent in Customs)
|
| Solubility (In Vitro) |
|
|||
|---|---|---|---|---|
| Solubility (In Vivo) |
Solubility in Formulation 1: ≥ 2.08 mg/mL (3.24 mM) (saturation unknown) in 10% DMSO + 40% PEG300 + 5% Tween80 + 45% Saline (add these co-solvents sequentially from left to right, and one by one), clear solution.
For example, if 1 mL of working solution is to be prepared, you can add 100 μL of 20.8 mg/mL clear DMSO stock solution to 400 μL PEG300 and mix evenly; then add 50 μL Tween-80 to the above solution and mix evenly; then add 450 μL normal saline to adjust the volume to 1 mL. Preparation of saline: Dissolve 0.9 g of sodium chloride in 100 mL ddH₂ O to obtain a clear solution. Solubility in Formulation 2: ≥ 2.08 mg/mL (3.24 mM) (saturation unknown) in 10% DMSO + 90% (20% SBE-β-CD in Saline) (add these co-solvents sequentially from left to right, and one by one), clear solution. For example, if 1 mL of working solution is to be prepared, you can add 100 μL of 20.8 mg/mL clear DMSO stock solution to 900 μL of 20% SBE-β-CD physiological saline solution and mix evenly. Preparation of 20% SBE-β-CD in Saline (4°C,1 week): Dissolve 2 g SBE-β-CD in 10 mL saline to obtain a clear solution. View More
Solubility in Formulation 3: ≥ 2.08 mg/mL (3.24 mM) (saturation unknown) in 10% DMSO + 90% Corn Oil (add these co-solvents sequentially from left to right, and one by one), clear solution. |
| Preparing Stock Solutions | 1 mg | 5 mg | 10 mg | |
| 1 mM | 1.5598 mL | 7.7990 mL | 15.5979 mL | |
| 5 mM | 0.3120 mL | 1.5598 mL | 3.1196 mL | |
| 10 mM | 0.1560 mL | 0.7799 mL | 1.5598 mL |
*Note: Please select an appropriate solvent for the preparation of stock solution based on your experiment needs. For most products, DMSO can be used for preparing stock solutions (e.g. 5 mM, 10 mM, or 20 mM concentration); some products with high aqueous solubility may be dissolved in water directly. Solubility information is available at the above Solubility Data section. Once the stock solution is prepared, aliquot it to routine usage volumes and store at -20°C or -80°C. Avoid repeated freeze and thaw cycles.
Calculation results
Working concentration: mg/mL;
Method for preparing DMSO stock solution: mg drug pre-dissolved in μL DMSO (stock solution concentration mg/mL). Please contact us first if the concentration exceeds the DMSO solubility of the batch of drug.
Method for preparing in vivo formulation::Take μL DMSO stock solution, next add μL PEG300, mix and clarify, next addμL Tween 80, mix and clarify, next add μL ddH2O,mix and clarify.
(1) Please be sure that the solution is clear before the addition of next solvent. Dissolution methods like vortex, ultrasound or warming and heat may be used to aid dissolving.
(2) Be sure to add the solvent(s) in order.
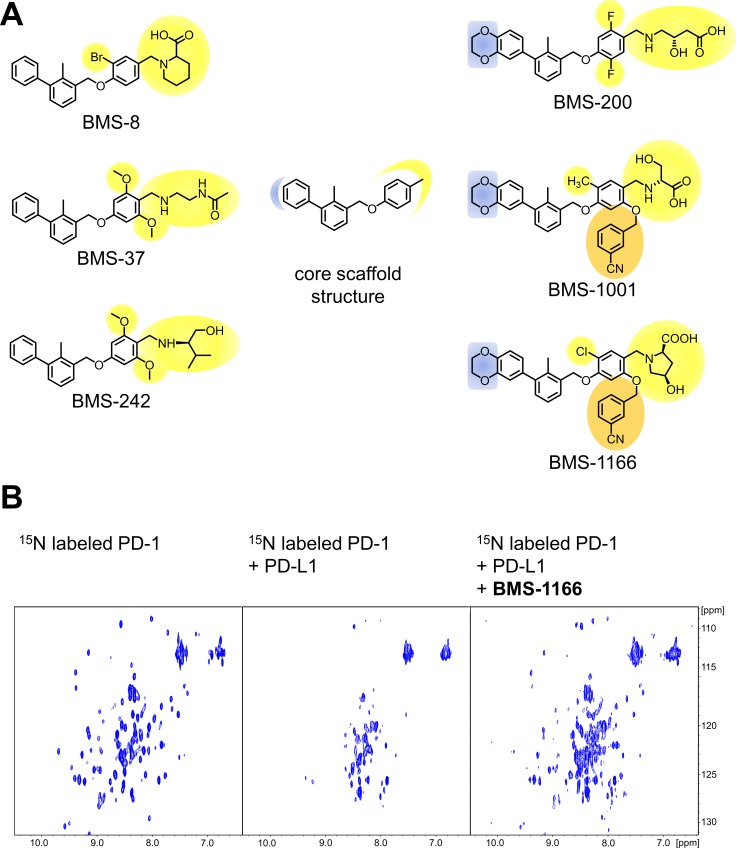
Structures and the PD-1/PD-L1 blocking potential of BMS compounds.Oncotarget.2017Aug 7;8(42):72167-72181. |
|---|
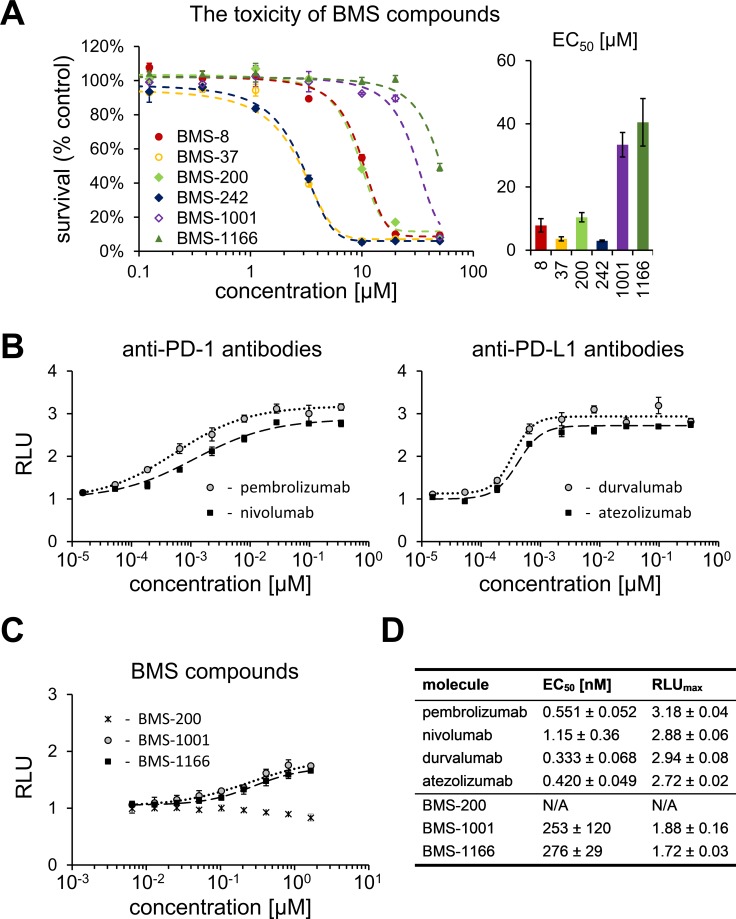
Cytotoxicity and activity of BMS compounds in PD-1/PD-L1 checkpoint assay.Oncotarget.2017Aug 7;8(42):72167-72181. |
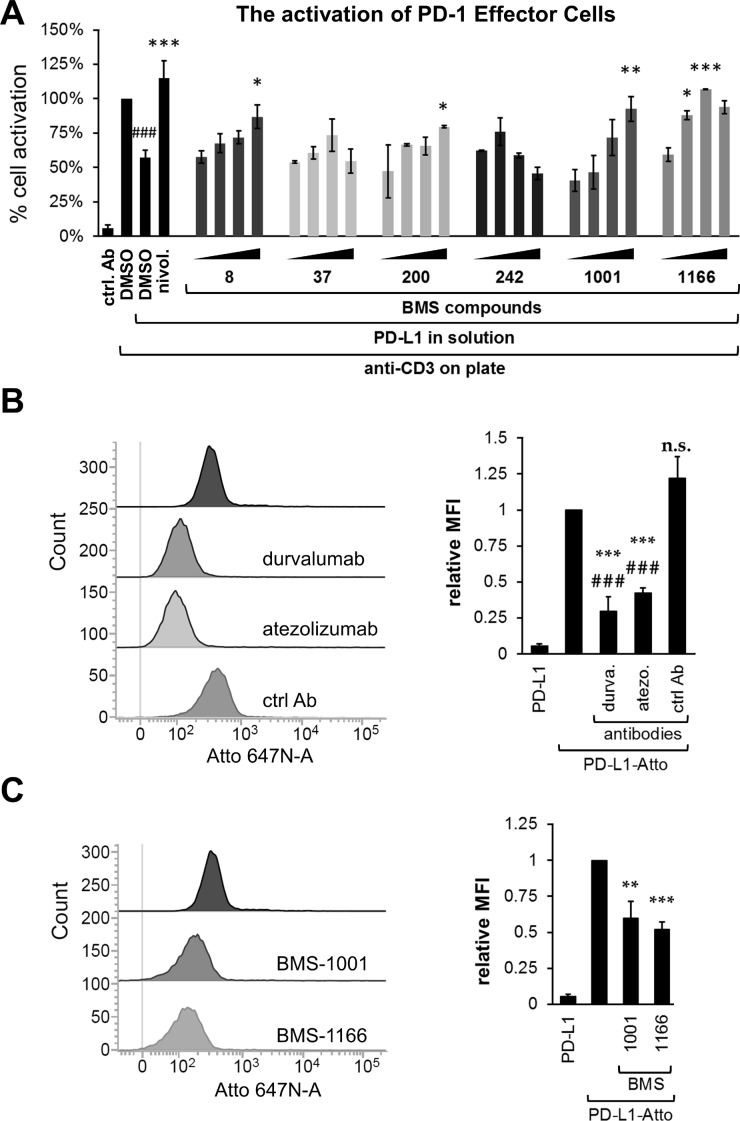
BMS compounds restore the sPD-L1-supressed activation of Jurkat T-cells.Oncotarget.2017 |
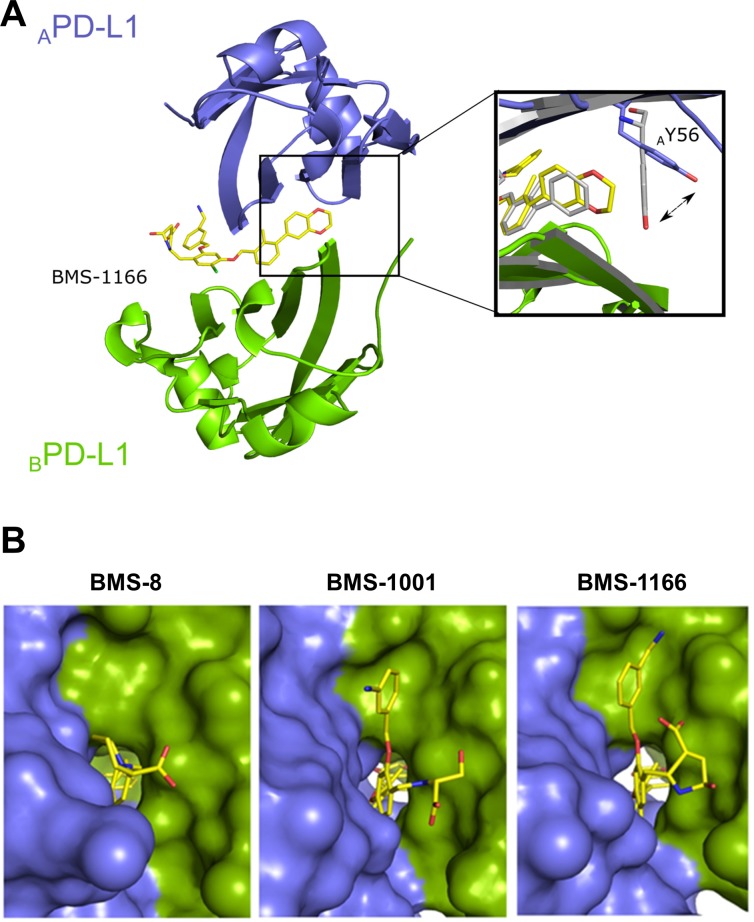
BMS-1166 induces binding cleft opening.Oncotarget.2017Aug 7;8(42):72167-72181. |
|---|
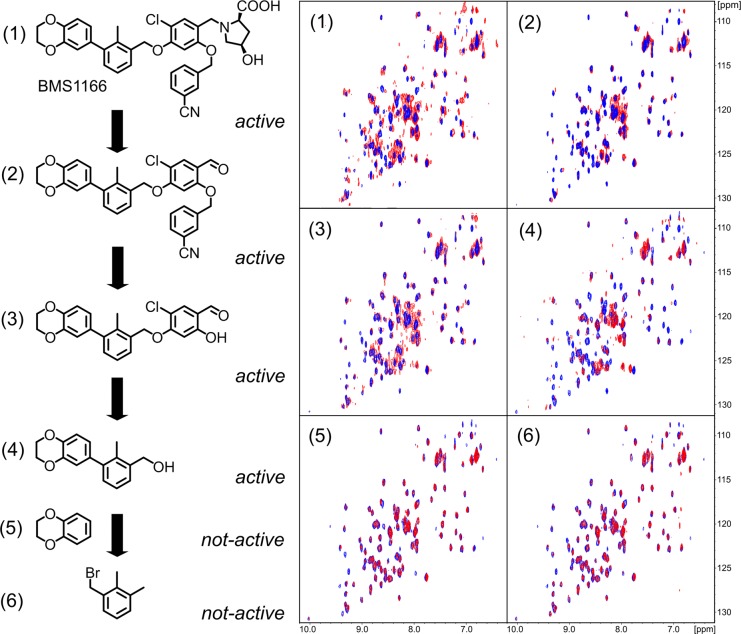
Decomposition of BMS-1166.Oncotarget.2017Aug 7;8(42):72167-72181. |
he prediction of BMS-1001 and −1166 binding sites on PD-L1 surface.Oncotarget.2017Aug 7;8(42):72167-72181. |
Products are for research use only; We do not sell to patients
Copyright 2020 InvivoChem LLC | All Rights Reserved


 COA
COA